Turkey external debt: how much does Türkiye owe abroad?
Gross external debt stock (quarterly) · Central Bank of the Republic of Türkiye
Short answer
549.2 USD bn
2026 Q3 +1.44%
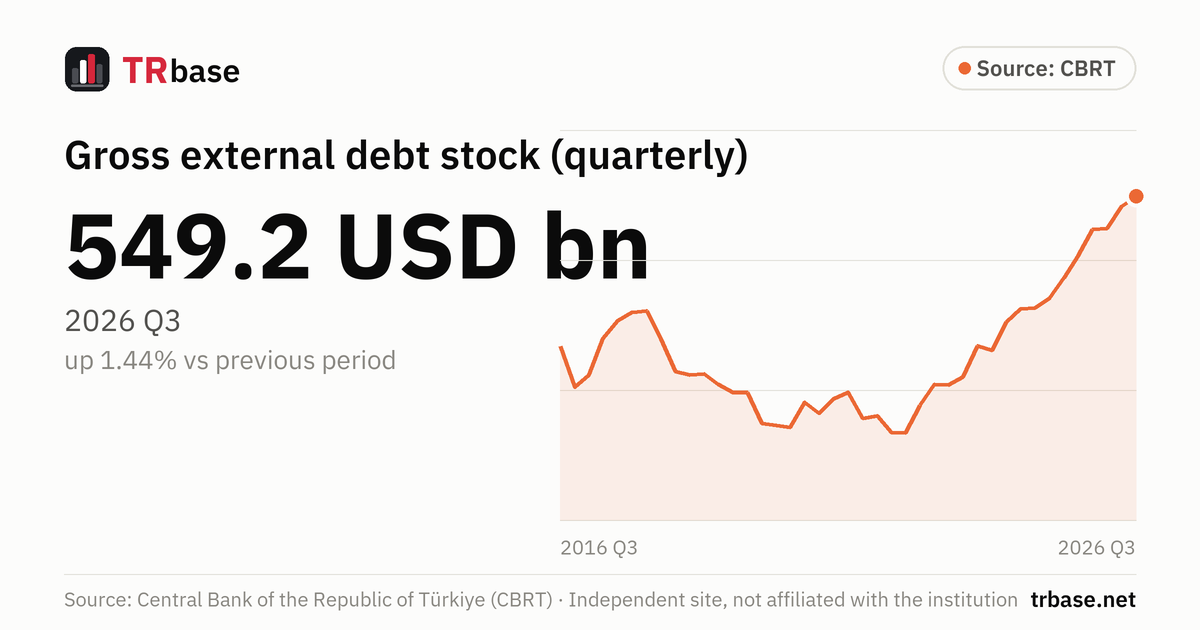
According to CBRT data, Türkiye's gross external debt stock was 549.2 USD bn at the end of 2026 Q3. That is up 1.44% from the previous quarter.
- External debt has risen for ten consecutive quarters.
- This is the highest value in the last 12 quarters.
- A year earlier (2025 Q3) it was 503.1 USD bn; the latest value is 9.16% higher.
Gross external debt stock (quarterly), 1989 Q4 – 2026 Q3
Unit: USD billion. Source: Central Bank of the Republic of Türkiye (CBRT). Hover over the chart, or focus it and use the arrow keys.
Data table
All values in the chart, newest first. Unit: USD billion.
| Period | External debt (USD billion) | Change vs previous period |
|---|---|---|
| 2026 Q3 | 549.2 | +1.44% |
| 2026 Q2 | 541.4 | +3.20% |
| 2026 Q1 | 524.6 | +0.19% |
| 2025 Q4 | 523.6 | +4.07% |
| 2025 Q3 | 503.1 | +3.48% |
| 2025 Q2 | 486.2 | +3.29% |
| 2025 Q1 | 470.7 | +1.62% |
| 2024 Q4 | 463.2 | +0.13% |
| 2024 Q3 | 462.6 | +2.21% |
| 2024 Q2 | 452.6 | +5.08% |
| 2024 Q1 | 430.7 | −0.74% |
| 2023 Q4 | 433.9 | +5.78% |
| 2023 Q3 | 410.2 | +1.48% |
| 2023 Q2 | 404.2 | −0.02% |
| 2023 Q1 | 404.3 | +4.15% |
| 2022 Q4 | 388.2 | +5.78% |
| 2022 Q3 | 367.0 | −0.14% |
| 2022 Q2 | 367.5 | −3.31% |
| 2022 Q1 | 380.1 | +0.53% |
| 2021 Q4 | 378.1 | −5.02% |
| 2021 Q3 | 398.1 | +1.27% |
| 2021 Q2 | 393.1 | +2.88% |
| 2021 Q1 | 382.1 | −2.15% |
| 2020 Q4 | 390.5 | +5.14% |
| 2020 Q3 | 371.4 | −0.35% |
| 2020 Q2 | 372.7 | −0.45% |
| 2020 Q1 | 374.4 | −6.00% |
| 2019 Q4 | 398.3 | 0.00% |
| 2019 Q3 | 398.3 | −1.51% |
| 2019 Q2 | 404.4 | −1.96% |
| 2019 Q1 | 412.5 | +0.17% |
| 2018 Q4 | 411.8 | −0.60% |
| 2018 Q3 | 414.3 | −5.76% |
| 2018 Q2 | 439.6 | −4.64% |
| 2018 Q1 | 461.0 | +0.22% |
| 2017 Q4 | 460.0 | +1.48% |
| 2017 Q3 | 453.3 | +3.09% |
| 2017 Q2 | 439.7 | +6.80% |
| 2017 Q1 | 411.7 | +2.39% |
| 2016 Q4 | 402.1 | −7.24% |
| 2016 Q3 | 433.5 | −1.28% |
| 2016 Q2 | 439.1 | +2.64% |
| 2016 Q1 | 427.8 | +3.43% |
| 2015 Q4 | 413.6 | −2.54% |
| 2015 Q3 | 424.4 | −3.13% |
| 2015 Q2 | 438.1 | +0.46% |
| 2015 Q1 | 436.1 | −4.20% |
| 2014 Q4 | 455.2 | +1.54% |
| 2014 Q3 | 448.3 | −2.22% |
| 2014 Q2 | 458.5 | +5.89% |
| 2014 Q1 | 433.0 | −1.81% |
| 2013 Q4 | 441.0 | +1.47% |
| 2013 Q3 | 434.6 | +0.67% |
| 2013 Q2 | 431.7 | +2.69% |
| 2013 Q1 | 420.4 | +2.06% |
| 2012 Q4 | 411.9 | +5.97% |
| 2012 Q3 | 388.7 | +5.03% |
| 2012 Q2 | 370.1 | +2.92% |
| 2012 Q1 | 359.6 | +4.57% |
| 2011 Q4 | 343.9 | −0.15% |
| 2011 Q3 | 344.4 | −2.90% |
| 2011 Q2 | 354.7 | +5.63% |
| 2011 Q1 | 335.8 | +4.81% |
| 2010 Q4 | 320.4 | +4.09% |
| 2010 Q3 | 307.8 | +8.42% |
| 2010 Q2 | 283.9 | +1.94% |
| 2010 Q1 | 278.5 | −0.57% |
| 2009 Q4 | 280.1 | −0.64% |
| 2009 Q3 | 281.9 | +1.48% |
| 2009 Q2 | 277.8 | +2.77% |
| 2009 Q1 | 270.3 | −7.27% |
| 2008 Q4 | 291.5 | −7.67% |
| 2008 Q3 | 315.7 | +1.12% |
| 2008 Q2 | 312.2 | +8.40% |
| 2008 Q1 | 288.0 | +4.01% |
| 2007 Q4 | 276.9 | +5.65% |
| 2007 Q3 | 262.1 | +4.71% |
| 2007 Q2 | 250.3 | +7.01% |
| 2007 Q1 | 233.9 | +1.96% |
| 2006 Q4 | 229.4 | +9.03% |
| 2006 Q3 | 210.4 | +4.47% |
| 2006 Q2 | 201.4 | +1.36% |
| 2006 Q1 | 198.7 | +8.52% |
| 2005 Q4 | 183.1 | +7.08% |
| 2005 Q3 | 171.0 | +2.09% |
| 2005 Q2 | 167.5 | +2.01% |
| 2005 Q1 | 164.2 | −0.91% |
| 2004 Q4 | 165.7 | +5.07% |
| 2004 Q3 | 157.7 | +3.34% |
| 2004 Q2 | 152.6 | +2.48% |
| 2004 Q1 | 148.9 | +0.34% |
| 2003 Q4 | 148.4 | +4.21% |
| 2003 Q3 | 142.4 | +3.41% |
| 2003 Q2 | 137.7 | +3.77% |
| 2003 Q1 | 132.7 | +0.68% |
| 2002 Q4 | 131.8 | +4.19% |
| 2002 Q3 | 126.5 | +1.44% |
| 2002 Q2 | 124.7 | +8.53% |
| 2002 Q1 | 114.9 | +1.14% |
| 2001 Q4 | 113.6 | −5.18% |
| 2001 Q3 | 119.8 | +4.72% |
| 2001 Q2 | 114.4 | −2.14% |
| 2001 Q1 | 116.9 | −1.43% |
| 2000 Q4 | 118.6 | +7.14% |
| 2000 Q3 | 110.7 | +1.10% |
| 2000 Q2 | 109.5 | +4.48% |
| 2000 Q1 | 104.8 | +1.65% |
| 1999 Q4 | 103.1 | +5.85% |
| 1999 Q3 | 97.4 | +4.06% |
| 1999 Q2 | 93.6 | −1.37% |
| 1999 Q1 | 94.9 | −1.56% |
| 1998 Q4 | 96.4 | +0.73% |
| 1998 Q3 | 95.7 | +5.86% |
| 1998 Q2 | 90.4 | +5.36% |
| 1998 Q1 | 85.8 | +1.66% |
| 1997 Q4 | 84.4 | +2.93% |
| 1997 Q3 | 82.0 | +3.02% |
| 1997 Q2 | 79.6 | +4.19% |
| 1997 Q1 | 76.4 | −3.66% |
| 1996 Q4 | 79.3 | +0.38% |
| 1996 Q3 | 79.0 | +0.38% |
| 1996 Q2 | 78.7 | +3.42% |
| 1996 Q1 | 76.1 | +0.26% |
| 1995 Q4 | 75.9 | +0.26% |
| 1995 Q3 | 75.7 | −0.53% |
| 1995 Q2 | 76.1 | +2.28% |
| 1995 Q1 | 74.4 | +8.30% |
| 1994 Q4 | 68.7 | −1.15% |
| 1994 Q3 | 69.5 | −0.43% |
| 1994 Q2 | 69.8 | −1.41% |
| 1994 Q1 | 70.8 | +0.43% |
| 1993 Q4 | 70.5 | +2.77% |
| 1993 Q3 | 68.6 | +7.86% |
| 1993 Q2 | 63.6 | +5.12% |
| 1993 Q1 | 60.5 | +3.24% |
| 1992 Q4 | 58.6 | −1.84% |
| 1992 Q3 | 59.7 | +7.37% |
| 1992 Q2 | 55.6 | +7.75% |
| 1992 Q1 | 51.6 | −3.73% |
| 1991 Q4 | 53.6 | +6.77% |
| 1991 Q3 | 50.2 | +3.72% |
| 1991 Q2 | 48.4 | −2.02% |
| 1991 Q1 | 49.4 | −5.73% |
| 1990 Q4 | 52.4 | +3.76% |
| 1990 Q3 | 50.5 | +8.14% |
| 1990 Q2 | 46.7 | +3.55% |
| 1990 Q1 | 45.1 | +2.73% |
| 1989 Q4 | 43.9 |
By debtor (USD billion)
| Period | External debt | Public sector | Private sector | Central bank |
|---|---|---|---|---|
| 2026 Q3 | 549.2 | 203.8 | 322.2 | 23.2 |
| 2026 Q2 | 541.4 | 201.4 | 316.9 | 23.1 |
| 2026 Q1 | 524.6 | 196.1 | 304.2 | 24.3 |
| 2025 Q4 | 523.6 | 199.9 | 298.7 | 25.0 |
| 2025 Q3 | 503.1 | 190.4 | 285.0 | 27.8 |
| 2025 Q2 | 486.2 | 179.2 | 277.7 | 29.3 |
| 2025 Q1 | 470.7 | 179.1 | 261.4 | 30.2 |
| 2024 Q4 | 463.2 | 176.0 | 252.6 | 34.7 |
| 2024 Q3 | 462.6 | 175.3 | 248.9 | 38.4 |
| 2024 Q2 | 452.6 | 166.1 | 241.8 | 44.7 |
| 2024 Q1 | 430.7 | 152.1 | 232.4 | 46.2 |
| 2023 Q4 | 433.9 | 149.6 | 238.0 | 46.4 |
| 2023 Q3 | 410.2 | 135.5 | 229.0 | 45.7 |
| 2023 Q2 | 404.2 | 133.8 | 224.2 | 46.2 |
| 2023 Q1 | 404.3 | 137.5 | 227.5 | 39.3 |
| 2022 Q4 | 388.2 | 127.8 | 227.6 | 32.8 |
| 2022 Q3 | 367.0 | 115.2 | 219.8 | 32.0 |
| 2022 Q2 | 367.5 | 119.7 | 218.5 | 29.4 |
| 2022 Q1 | 380.1 | 131.1 | 219.2 | 29.8 |
| 2021 Q4 | 378.1 | 133.9 | 218.1 | 26.1 |
| 2021 Q3 | 398.1 | 152.2 | 220.0 | 25.9 |
| 2021 Q2 | 393.1 | 145.7 | 221.7 | 25.8 |
| 2021 Q1 | 382.1 | 143.9 | 215.6 | 22.6 |
| 2020 Q4 | 390.5 | 148.7 | 220.5 | 21.3 |
| 2020 Q3 | 371.4 | 136.9 | 213.5 | 21.0 |
| 2020 Q2 | 372.7 | 139.7 | 213.4 | 19.6 |
| 2020 Q1 | 374.4 | 145.1 | 220.9 | 8.4 |
| 2019 Q4 | 398.3 | 148.4 | 241.4 | 8.5 |
| 2019 Q3 | 398.3 | 135.9 | 256.0 | 6.4 |
| 2019 Q2 | 404.4 | 135.5 | 262.4 | 6.5 |
| 2019 Q1 | 412.5 | 138.1 | 268.5 | 5.9 |
| 2018 Q4 | 411.8 | 136.3 | 269.6 | 5.9 |
| 2018 Q3 | 414.3 | 125.8 | 281.8 | 6.7 |
| 2018 Q2 | 439.6 | 138.0 | 299.8 | 1.8 |
| 2018 Q1 | 461.0 | 149.3 | 310.3 | 1.4 |
| 2017 Q4 | 460.0 | 149.0 | 309.2 | 1.8 |
| 2017 Q3 | 453.3 | 152.5 | 299.5 | 1.3 |
| 2017 Q2 | 439.7 | 147.3 | 291.0 | 1.4 |
| 2017 Q1 | 411.7 | 134.3 | 276.0 | 1.4 |
| 2016 Q4 | 402.1 | 128.8 | 272.2 | 1.1 |
| 2016 Q3 | 433.5 | 145.4 | 287.2 | 1.0 |
| 2016 Q2 | 439.1 | 144.1 | 293.8 | 1.2 |
| 2016 Q1 | 427.8 | 139.0 | 287.5 | 1.3 |
| 2015 Q4 | 413.6 | 130.8 | 281.4 | 1.3 |
| 2015 Q3 | 424.4 | 133.5 | 289.4 | 1.5 |
| 2015 Q2 | 438.1 | 145.3 | 290.8 | 2.0 |
| 2015 Q1 | 436.1 | 151.5 | 282.5 | 2.1 |
| 2014 Q4 | 455.2 | 162.4 | 290.3 | 2.5 |
| 2014 Q3 | 448.3 | 159.2 | 286.2 | 2.9 |
| 2014 Q2 | 458.5 | 166.0 | 288.3 | 4.3 |
| 2014 Q1 | 433.0 | 152.0 | 276.1 | 4.9 |
| 2013 Q4 | 441.0 | 156.1 | 279.7 | 5.2 |
| 2013 Q3 | 434.6 | 158.5 | 270.5 | 5.6 |
| 2013 Q2 | 431.7 | 160.1 | 265.3 | 6.4 |
| 2013 Q1 | 420.4 | 161.2 | 252.6 | 6.6 |
| 2012 Q4 | 411.9 | 161.5 | 243.3 | 7.1 |
| 2012 Q3 | 388.7 | 149.8 | 231.4 | 7.4 |
| 2012 Q2 | 370.1 | 136.7 | 225.1 | 8.3 |
| 2012 Q1 | 359.6 | 131.4 | 218.9 | 9.3 |
| 2011 Q4 | 343.9 | 119.5 | 215.1 | 9.3 |
| 2011 Q3 | 344.4 | 111.8 | 222.3 | 10.3 |
| 2011 Q2 | 354.7 | 117.6 | 225.2 | 11.9 |
| 2011 Q1 | 335.8 | 112.7 | 211.1 | 12.0 |
| 2010 Q4 | 320.4 | 100.7 | 208.1 | 11.6 |
| 2010 Q3 | 307.8 | 103.3 | 192.4 | 12.1 |
| 2010 Q2 | 283.9 | 92.3 | 180.5 | 11.1 |
| 2010 Q1 | 278.5 | 89.0 | 177.1 | 12.4 |
| 2009 Q4 | 280.1 | 86.8 | 180.2 | 13.2 |
| 2009 Q3 | 281.9 | 88.1 | 180.2 | 13.5 |
| 2009 Q2 | 277.8 | 81.8 | 182.4 | 13.5 |
| 2009 Q1 | 270.3 | 77.3 | 180.1 | 13.0 |
| 2008 Q4 | 291.5 | 85.3 | 192.2 | 14.1 |
| 2008 Q3 | 315.7 | 93.5 | 207.9 | 14.3 |
| 2008 Q2 | 312.2 | 93.8 | 202.2 | 16.2 |
| 2008 Q1 | 288.0 | 89.2 | 182.3 | 16.6 |
| 2007 Q4 | 276.9 | 91.4 | 169.7 | 15.8 |
| 2007 Q3 | 262.1 | 92.3 | 154.3 | 15.6 |
| 2007 Q2 | 250.3 | 90.7 | 144.0 | 15.5 |
| 2007 Q1 | 233.9 | 88.0 | 130.3 | 15.6 |
| 2006 Q4 | 229.4 | 86.0 | 127.7 | 15.7 |
| 2006 Q3 | 210.4 | 77.1 | 117.8 | 15.5 |
| 2006 Q2 | 201.4 | 71.1 | 114.5 | 15.8 |
| 2006 Q1 | 198.7 | 79.7 | 103.5 | 15.5 |
| 2005 Q4 | 183.1 | 78.2 | 89.5 | 15.4 |
| 2005 Q3 | 171.0 | 71.1 | 83.7 | 16.2 |
| 2005 Q2 | 167.5 | 72.5 | 77.9 | 17.1 |
| 2005 Q1 | 164.2 | 75.5 | 69.4 | 19.4 |
| 2004 Q4 | 165.7 | 75.8 | 68.5 | 21.4 |
| 2004 Q3 | 157.7 | 72.8 | 64.0 | 20.8 |
| 2004 Q2 | 152.6 | 70.6 | 60.4 | 21.7 |
| 2004 Q1 | 148.9 | 70.0 | 56.0 | 22.9 |
| 2003 Q4 | 148.4 | 70.8 | 53.1 | 24.4 |
| 2003 Q3 | 142.4 | 68.8 | 50.3 | 23.3 |
| 2003 Q2 | 137.7 | 67.5 | 46.9 | 23.4 |
| 2003 Q1 | 132.7 | 65.0 | 45.3 | 22.4 |
| 2002 Q4 | 131.8 | 64.5 | 45.3 | 22.0 |
| 2002 Q3 | 126.5 | 62.7 | 42.9 | 20.9 |
| 2002 Q2 | 124.7 | 60.5 | 43.9 | 20.4 |
| 2002 Q1 | 114.9 | 56.5 | 39.9 | 18.4 |
| 2001 Q4 | 113.6 | 47.1 | 42.1 | 24.4 |
| 2001 Q3 | 119.8 | 48.9 | 48.1 | 22.7 |
| 2001 Q2 | 114.4 | 46.0 | 50.1 | 18.3 |
| 2001 Q1 | 116.9 | 49.2 | 52.8 | 14.9 |
| 2000 Q4 | 118.6 | 50.1 | 54.4 | 14.1 |
| 2000 Q3 | 110.7 | 48.0 | 52.0 | 10.7 |
| 2000 Q2 | 109.5 | 48.1 | 50.3 | 11.0 |
| 2000 Q1 | 104.8 | 45.2 | 48.9 | 10.6 |
| 1999 Q4 | 103.1 | 44.1 | 48.0 | 11.0 |
| 1999 Q3 | 97.4 | 41.3 | 44.7 | 11.4 |
| 1999 Q2 | 93.6 | 40.1 | 42.1 | 11.4 |
| 1999 Q1 | 94.9 | 40.6 | 42.2 | 12.1 |
| 1998 Q4 | 96.4 | 41.3 | 42.0 | 13.0 |
| 1998 Q3 | 95.7 | 39.5 | 43.2 | 13.0 |
| 1998 Q2 | 90.4 | 39.0 | 39.5 | 11.9 |
| 1998 Q1 | 85.8 | 39.0 | 35.1 | 11.7 |
| 1997 Q4 | 84.4 | 39.1 | 33.5 | 11.8 |
| 1997 Q3 | 82.0 | 39.3 | 30.9 | 11.8 |
| 1997 Q2 | 79.6 | 39.2 | 28.8 | 11.6 |
| 1997 Q1 | 76.4 | 38.6 | 26.0 | 11.8 |
| 1996 Q4 | 79.3 | 40.2 | 26.7 | 12.4 |
| 1996 Q3 | 79.0 | 41.4 | 25.1 | 12.5 |
| 1996 Q2 | 78.7 | 41.8 | 24.9 | 12.0 |
| 1996 Q1 | 76.1 | 41.7 | 22.3 | 12.2 |
| 1995 Q4 | 75.9 | 42.0 | 21.8 | 12.2 |
| 1995 Q3 | 75.7 | 42.2 | 21.5 | 12.0 |
| 1995 Q2 | 76.1 | 44.0 | 20.4 | 11.6 |
| 1995 Q1 | 74.4 | 44.1 | 19.2 | 11.1 |
| 1994 Q4 | 68.7 | 41.7 | 17.2 | 9.8 |
| 1994 Q3 | 69.5 | 42.3 | 17.9 | 9.3 |
| 1994 Q2 | 69.8 | 42.5 | 18.9 | 8.4 |
| 1994 Q1 | 70.8 | 41.7 | 21.3 | 7.9 |
| 1993 Q4 | 70.5 | 39.6 | 23.6 | 7.3 |
| 1993 Q3 | 68.6 | 39.9 | 21.1 | 7.6 |
| 1993 Q2 | 63.6 | 38.5 | 18.1 | 7.0 |
| 1993 Q1 | 60.5 | 37.9 | 15.6 | 7.0 |
| 1992 Q4 | 58.6 | 36.5 | 15.4 | 6.7 |
| 1992 Q3 | 59.7 | 38.2 | 14.1 | 7.5 |
| 1992 Q2 | 55.6 | 36.1 | 12.6 | 6.9 |
| 1992 Q1 | 51.6 | 34.0 | 10.9 | 6.7 |
| 1991 Q4 | 53.6 | 35.3 | 11.1 | 7.2 |
| 1991 Q3 | 50.2 | 33.0 | 10.6 | 6.6 |
| 1991 Q2 | 48.4 | 31.7 | 10.5 | 6.2 |
| 1991 Q1 | 49.4 | 32.0 | 10.7 | 6.6 |
| 1990 Q4 | 52.4 | 33.3 | 10.8 | 8.3 |
| 1990 Q3 | 50.5 | 32.1 | 10.2 | 8.2 |
| 1990 Q2 | 46.7 | 30.5 | 8.4 | 7.8 |
| 1990 Q1 | 45.1 | 29.7 | 7.6 | 7.8 |
| 1989 Q4 | 43.9 | 29.4 | 6.6 | 7.8 |
By maturity (USD billion)
| Period | External debt | Short-term | Long-term |
|---|---|---|---|
| 2026 Q3 | 549.2 | 173.1 | 376.1 |
| 2026 Q2 | 541.4 | 170.5 | 370.9 |
| 2026 Q1 | 524.6 | 166.4 | 358.1 |
| 2025 Q4 | 523.6 | 167.3 | 356.3 |
| 2025 Q3 | 503.1 | 166.7 | 336.5 |
| 2025 Q2 | 486.2 | 170.2 | 316.0 |
| 2025 Q1 | 470.7 | 168.8 | 301.8 |
| 2024 Q4 | 463.2 | 173.0 | 290.3 |
| 2024 Q3 | 462.6 | 172.4 | 290.2 |
| 2024 Q2 | 452.6 | 175.3 | 277.3 |
| 2024 Q1 | 430.7 | 170.5 | 260.2 |
| 2023 Q4 | 433.9 | 175.0 | 258.9 |
| 2023 Q3 | 410.2 | 168.3 | 241.9 |
| 2023 Q2 | 404.2 | 165.1 | 239.2 |
| 2023 Q1 | 404.3 | 160.8 | 243.5 |
| 2022 Q4 | 388.2 | 148.4 | 239.8 |
| 2022 Q3 | 367.0 | 138.0 | 229.0 |
| 2022 Q2 | 367.5 | 133.2 | 234.3 |
| 2022 Q1 | 380.1 | 128.3 | 251.8 |
| 2021 Q4 | 378.1 | 118.2 | 259.8 |
| 2021 Q3 | 398.1 | 121.7 | 276.4 |
| 2021 Q2 | 393.1 | 119.8 | 273.3 |
| 2021 Q1 | 382.1 | 112.7 | 269.4 |
| 2020 Q4 | 390.5 | 111.5 | 279.0 |
| 2020 Q3 | 371.4 | 105.9 | 265.5 |
| 2020 Q2 | 372.7 | 98.9 | 273.8 |
| 2020 Q1 | 374.4 | 92.3 | 282.1 |
| 2019 Q4 | 398.3 | 95.5 | 302.7 |
| 2019 Q3 | 398.3 | 93.7 | 304.6 |
| 2019 Q2 | 404.4 | 95.6 | 308.9 |
| 2019 Q1 | 412.5 | 93.1 | 319.4 |
| 2018 Q4 | 411.8 | 92.7 | 319.1 |
| 2018 Q3 | 414.3 | 99.4 | 314.9 |
| 2018 Q2 | 439.6 | 106.9 | 332.7 |
| 2018 Q1 | 461.0 | 108.2 | 352.8 |
| 2017 Q4 | 460.0 | 109.6 | 350.4 |
| 2017 Q3 | 453.3 | 105.7 | 347.6 |
| 2017 Q2 | 439.7 | 102.8 | 336.9 |
| 2017 Q1 | 411.7 | 96.8 | 314.9 |
| 2016 Q4 | 402.1 | 90.2 | 311.9 |
| 2016 Q3 | 433.5 | 101.2 | 332.4 |
| 2016 Q2 | 439.1 | 107.5 | 331.5 |
| 2016 Q1 | 427.8 | 106.6 | 321.2 |
| 2015 Q4 | 413.6 | 104.6 | 309.0 |
| 2015 Q3 | 424.4 | 121.6 | 302.9 |
| 2015 Q2 | 438.1 | 133.2 | 304.8 |
| 2015 Q1 | 436.1 | 136.9 | 299.2 |
| 2014 Q4 | 455.2 | 142.6 | 312.7 |
| 2014 Q3 | 448.3 | 142.8 | 305.5 |
| 2014 Q2 | 458.5 | 142.1 | 316.4 |
| 2014 Q1 | 433.0 | 135.8 | 297.2 |
| 2013 Q4 | 441.0 | 141.8 | 299.2 |
| 2013 Q3 | 434.6 | 138.0 | 296.6 |
| 2013 Q2 | 431.7 | 135.2 | 296.5 |
| 2013 Q1 | 420.4 | 124.8 | 295.6 |
| 2012 Q4 | 411.9 | 114.6 | 297.3 |
| 2012 Q3 | 388.7 | 110.5 | 278.2 |
| 2012 Q2 | 370.1 | 109.7 | 260.4 |
| 2012 Q1 | 359.6 | 101.1 | 258.5 |
| 2011 Q4 | 343.9 | 96.9 | 247.0 |
| 2011 Q3 | 344.4 | 101.1 | 243.4 |
| 2011 Q2 | 354.7 | 101.3 | 253.4 |
| 2011 Q1 | 335.8 | 90.2 | 245.6 |
| 2010 Q4 | 320.4 | 92.9 | 227.5 |
| 2010 Q3 | 307.8 | 79.0 | 228.8 |
| 2010 Q2 | 283.9 | 70.4 | 213.6 |
| 2010 Q1 | 278.5 | 60.1 | 218.3 |
| 2009 Q4 | 280.1 | 56.0 | 224.1 |
| 2009 Q3 | 281.9 | 53.5 | 228.4 |
| 2009 Q2 | 277.8 | 52.5 | 225.2 |
| 2009 Q1 | 270.3 | 50.3 | 220.0 |
| 2008 Q4 | 291.5 | 56.3 | 235.2 |
| 2008 Q3 | 315.7 | 65.9 | 249.8 |
| 2008 Q2 | 312.2 | 61.7 | 250.5 |
| 2008 Q1 | 288.0 | 53.8 | 234.2 |
| 2007 Q4 | 276.9 | 51.7 | 225.3 |
| 2007 Q3 | 262.1 | 46.5 | 215.6 |
| 2007 Q2 | 250.3 | 46.6 | 203.7 |
| 2007 Q1 | 233.9 | 42.2 | 191.6 |
| 2006 Q4 | 229.4 | 49.2 | 180.2 |
| 2006 Q3 | 210.4 | 48.6 | 161.8 |
| 2006 Q2 | 201.4 | 49.5 | 151.9 |
| 2006 Q1 | 198.7 | 45.9 | 152.8 |
| 2005 Q4 | 183.1 | 43.5 | 139.6 |
| 2005 Q3 | 171.0 | 43.5 | 127.5 |
| 2005 Q2 | 167.5 | 40.1 | 127.3 |
| 2005 Q1 | 164.2 | 37.2 | 127.0 |
| 2004 Q4 | 165.7 | 36.6 | 129.1 |
| 2004 Q3 | 157.7 | 34.7 | 123.1 |
| 2004 Q2 | 152.6 | 32.2 | 120.4 |
| 2004 Q1 | 148.9 | 28.9 | 120.0 |
| 2003 Q4 | 148.4 | 27.3 | 121.1 |
| 2003 Q3 | 142.4 | 24.8 | 117.6 |
| 2003 Q2 | 137.7 | 21.1 | 116.6 |
| 2003 Q1 | 132.7 | 19.9 | 112.8 |
| 2002 Q4 | 131.8 | 18.7 | 113.1 |
| 2002 Q3 | 126.5 | 16.8 | 109.7 |
| 2002 Q2 | 124.7 | 17.5 | 107.3 |
| 2002 Q1 | 114.9 | 16.1 | 98.8 |
| 2001 Q4 | 113.6 | 16.4 | 97.2 |
| 2001 Q3 | 119.8 | 20.1 | 99.7 |
| 2001 Q2 | 114.4 | 22.1 | 92.2 |
| 2001 Q1 | 116.9 | 26.0 | 90.9 |
| 2000 Q4 | 118.6 | 28.3 | 90.3 |
| 2000 Q3 | 110.7 | 26.0 | 84.7 |
| 2000 Q2 | 109.5 | 24.4 | 85.0 |
| 2000 Q1 | 104.8 | 24.2 | 80.6 |
| 1999 Q4 | 103.1 | 22.9 | 80.2 |
| 1999 Q3 | 97.4 | 21.6 | 75.8 |
| 1999 Q2 | 93.6 | 20.5 | 73.2 |
| 1999 Q1 | 94.9 | 20.7 | 74.2 |
| 1998 Q4 | 96.4 | 20.8 | 75.6 |
| 1998 Q3 | 95.7 | 20.9 | 74.9 |
| 1998 Q2 | 90.4 | 19.7 | 70.7 |
| 1998 Q1 | 85.8 | 18.2 | 67.6 |
| 1997 Q4 | 84.4 | 17.7 | 66.7 |
| 1997 Q3 | 82.0 | 17.4 | 64.5 |
| 1997 Q2 | 79.6 | 16.8 | 62.8 |
| 1997 Q1 | 76.4 | 15.5 | 60.9 |
| 1996 Q4 | 79.3 | 17.1 | 62.2 |
| 1996 Q3 | 79.0 | 17.3 | 61.7 |
| 1996 Q2 | 78.7 | 18.3 | 60.3 |
| 1996 Q1 | 76.1 | 16.0 | 60.1 |
| 1995 Q4 | 75.9 | 15.5 | 60.4 |
| 1995 Q3 | 75.7 | 15.4 | 60.3 |
| 1995 Q2 | 76.1 | 14.1 | 62.0 |
| 1995 Q1 | 74.4 | 13.0 | 61.4 |
| 1994 Q4 | 68.7 | 11.2 | 57.5 |
| 1994 Q3 | 69.5 | 12.0 | 57.4 |
| 1994 Q2 | 69.8 | 13.1 | 56.7 |
| 1994 Q1 | 70.8 | 15.8 | 55.0 |
| 1993 Q4 | 70.5 | 18.5 | 52.0 |
| 1993 Q3 | 68.6 | 16.5 | 52.1 |
| 1993 Q2 | 63.6 | 14.5 | 49.1 |
| 1993 Q1 | 60.5 | 12.6 | 47.9 |
| 1992 Q4 | 58.6 | 12.7 | 45.9 |
| 1992 Q3 | 59.7 | 11.7 | 48.0 |
| 1992 Q2 | 55.6 | 10.2 | 45.4 |
| 1992 Q1 | 51.6 | 8.8 | 42.8 |
| 1991 Q4 | 53.6 | 9.1 | 44.5 |
| 1991 Q3 | 50.2 | 8.6 | 41.6 |
| 1991 Q2 | 48.4 | 8.8 | 39.6 |
| 1991 Q1 | 49.4 | 9.2 | 40.2 |
| 1990 Q4 | 52.4 | 9.5 | 42.9 |
| 1990 Q3 | 50.5 | 9.0 | 41.5 |
| 1990 Q2 | 46.7 | 7.4 | 39.3 |
| 1990 Q1 | 45.1 | 6.7 | 38.4 |
| 1989 Q4 | 43.9 | 5.7 | 38.2 |
Related indicators
Trade, tourism and current accountExports (monthly, general trade system)
25.97 USD bn
September 2026 +10.72%
Imports (monthly, general trade system)
31.13 USD bn
September 2026 +8.45%
Foreign trade deficit (monthly, general trade system)
5.16 USD bn
September 2026 −1.71%
Tourism income (quarterly)
25.53 USD bn
2026 Q3 +60.83%
Exports to imports coverage ratio (monthly, general trade system)
83.4%
September 2026 +1.7 pp
Terms of trade (export unit value / import unit value)
88.0
September 2026 −2.0 pp
What does this indicator measure?
The gross external debt stock is the total debt owed by residents of Türkiye to non-residents that requires payments of principal and/or interest in the future. It covers the external debt of the public sector, the CBRT and the private sector.
The CBRT publishes the gross external debt stock quarterly, broken down by debtor, maturity, instrument and currency. Values are in USD million; on this page they are converted to USD billion. The series starts at the end of 1989.
Short-term external debt is debt with an original maturity of up to 1 year (365 days included); the short-term external debt stock is also published monthly.
How to read it
- The value is the stock on the last day of the quarter; it is not the amount of new borrowing in that quarter.
- Debt is measured in US dollars; the dollar value of debt in other currencies such as the euro and the Turkish lira also changes with exchange rates.
- The change in the table is the percent change from the previous quarter.
Common misreadings
- External debt is not only government debt; the debt of the private sector, including banks and companies, is also in the total. The breakdown is in the "By debtor" view on the chart.
- Gross external debt is calculated without deducting assets abroad; it is not the same as net external debt.
- Public external debt is not the same as the public debt stock; the public debt stock also includes domestic debt.
Frequently asked questions
How much is Turkey's external debt?
According to CBRT data, the gross external debt stock was 549.2 USD bn at the end of 2026 Q3. At the end of the previous quarter (2026 Q2) it was 541.4 USD bn.
When will the next external debt data be released?
According to the CBRT's release calendar, the next External Debt Statistics of Türkiye release is on not yet announced.
How much of the external debt is public and how much is private?
The "By debtor" view on the chart shows the external debt of the public sector, the private sector and the CBRT separately; the three add up to the gross external debt stock.
What is short-term external debt?
External debt with an original maturity of up to 1 year (365 days included). The CBRT also publishes the short-term external debt stock monthly.
In which currency is external debt measured?
The CBRT publishes the external debt stock in USD million. Debt in other currencies is converted to dollars and added up.