Turkey GDP growth rate
GDP growth rate (annual change, quarterly) · Turkish Statistical Institute
Short answer
2.3%
2026 Q2 −0.3 pp
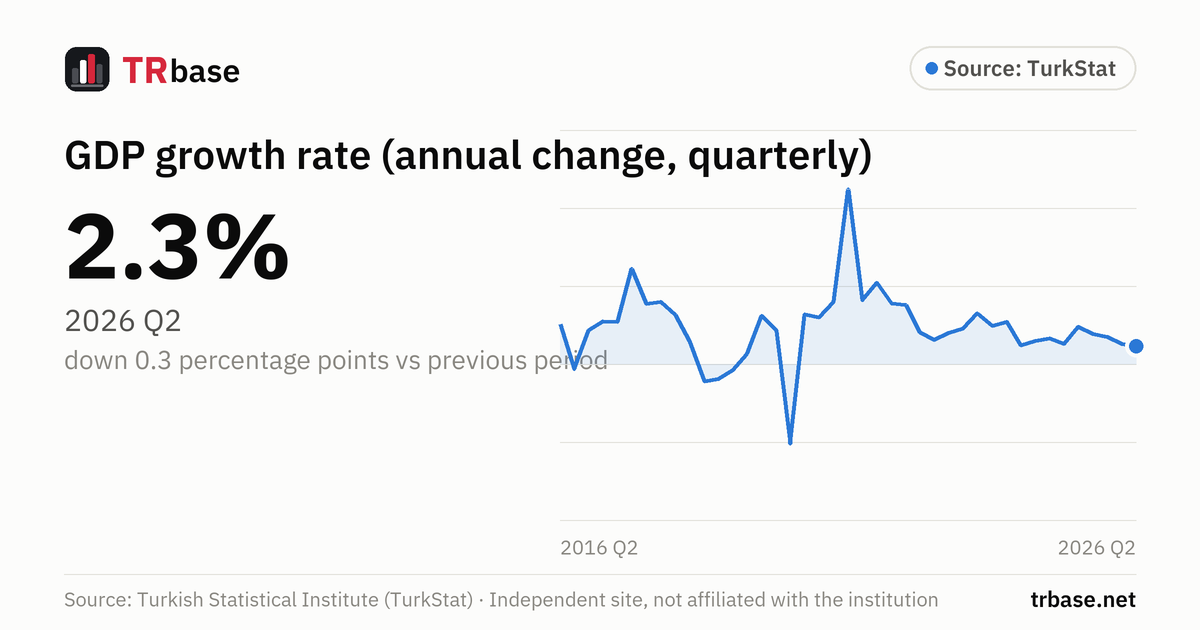
According to TurkStat, Türkiye's growth rate (GDP, compared with the same quarter of the previous year) was 2.3% in 2026 Q2. That is down 0.3 percentage points from the previous quarter.
- GDP growth has fallen for four consecutive quarters.
- This is the lowest value in the last 12 quarters.
- A year earlier (2025 Q2) it was 4.8%; the latest value is 2.5 percentage points lower.
Next release: Tuesday 1 December 2026, 10:00
GDP growth rate (annual change, quarterly), 1996 Q1 – 2026 Q2
Unit: %. Source: Turkish Statistical Institute (TurkStat). Hover over the chart, or focus it and use the arrow keys.
Data table
All values in the chart, newest first. Unit: %.
| Period | GDP growth (%) | Change vs previous period |
|---|---|---|
| 2026 Q2 | 2.3 | −0.3 pp |
| 2026 Q1 | 2.6 | −0.9 pp |
| 2025 Q4 | 3.5 | −0.4 pp |
| 2025 Q3 | 3.9 | −0.9 pp |
| 2025 Q2 | 4.8 | +2.2 pp |
| 2025 Q1 | 2.6 | −0.7 pp |
| 2024 Q4 | 3.3 | +0.3 pp |
| 2024 Q3 | 3.0 | +0.6 pp |
| 2024 Q2 | 2.4 | −3.0 pp |
| 2024 Q1 | 5.4 | +0.5 pp |
| 2023 Q4 | 4.9 | −1.6 pp |
| 2023 Q3 | 6.5 | +1.9 pp |
| 2023 Q2 | 4.6 | +0.6 pp |
| 2023 Q1 | 4.0 | +0.9 pp |
| 2022 Q4 | 3.1 | −1.0 pp |
| 2022 Q3 | 4.1 | −3.5 pp |
| 2022 Q2 | 7.6 | −0.2 pp |
| 2022 Q1 | 7.8 | −2.6 pp |
| 2021 Q4 | 10.4 | +2.2 pp |
| 2021 Q3 | 8.2 | −14.2 pp |
| 2021 Q2 | 22.4 | +14.4 pp |
| 2021 Q1 | 8.0 | +2.0 pp |
| 2020 Q4 | 6.0 | −0.4 pp |
| 2020 Q3 | 6.4 | +16.6 pp |
| 2020 Q2 | −10.2 | −14.5 pp |
| 2020 Q1 | 4.3 | −1.9 pp |
| 2019 Q4 | 6.2 | +4.9 pp |
| 2019 Q3 | 1.3 | +2.1 pp |
| 2019 Q2 | −0.8 | +1.1 pp |
| 2019 Q1 | −1.9 | +0.3 pp |
| 2018 Q4 | −2.2 | −5.2 pp |
| 2018 Q3 | 3.0 | −3.3 pp |
| 2018 Q2 | 6.3 | −1.7 pp |
| 2018 Q1 | 8.0 | +0.3 pp |
| 2017 Q4 | 7.7 | −4.5 pp |
| 2017 Q3 | 12.2 | +6.8 pp |
| 2017 Q2 | 5.4 | −0.1 pp |
| 2017 Q1 | 5.5 | +1.2 pp |
| 2016 Q4 | 4.3 | +5.0 pp |
| 2016 Q3 | −0.7 | −5.8 pp |
| 2016 Q2 | 5.1 | +0.1 pp |
| 2016 Q1 | 5.0 | −2.8 pp |
| 2015 Q4 | 7.8 | +2.1 pp |
| 2015 Q3 | 5.7 | −0.9 pp |
| 2015 Q2 | 6.6 | +3.9 pp |
| 2015 Q1 | 2.7 | −2.3 pp |
| 2014 Q4 | 5.0 | +2.0 pp |
| 2014 Q3 | 3.0 | +0.4 pp |
| 2014 Q2 | 2.6 | −5.6 pp |
| 2014 Q1 | 8.2 | +1.3 pp |
| 2013 Q4 | 6.9 | −1.8 pp |
| 2013 Q3 | 8.7 | −1.2 pp |
| 2013 Q2 | 9.9 | +1.3 pp |
| 2013 Q1 | 8.6 | +4.4 pp |
| 2012 Q4 | 4.2 | +0.4 pp |
| 2012 Q3 | 3.8 | −1.2 pp |
| 2012 Q2 | 5.0 | −1.6 pp |
| 2012 Q1 | 6.6 | −3.2 pp |
| 2011 Q4 | 9.8 | −1.5 pp |
| 2011 Q3 | 11.3 | 0.0 pp |
| 2011 Q2 | 11.3 | −0.3 pp |
| 2011 Q1 | 11.6 | +1.7 pp |
| 2010 Q4 | 9.9 | +1.2 pp |
| 2010 Q3 | 8.7 | +0.8 pp |
| 2010 Q2 | 7.9 | +0.4 pp |
| 2010 Q1 | 7.5 | +5.3 pp |
| 2009 Q4 | 2.2 | +3.7 pp |
| 2009 Q3 | −1.5 | +4.7 pp |
| 2009 Q2 | −6.2 | +8.5 pp |
| 2009 Q1 | −14.7 | −8.3 pp |
| 2008 Q4 | −6.4 | −7.7 pp |
| 2008 Q3 | 1.3 | −1.5 pp |
| 2008 Q2 | 2.8 | −4.5 pp |
| 2008 Q1 | 7.3 | +0.7 pp |
| 2007 Q4 | 6.6 | +2.3 pp |
| 2007 Q3 | 4.3 | +2.0 pp |
| 2007 Q2 | 2.3 | −5.2 pp |
| 2007 Q1 | 7.5 | +1.1 pp |
| 2006 Q4 | 6.4 | +1.0 pp |
| 2006 Q3 | 5.4 | −4.8 pp |
| 2006 Q2 | 10.2 | +3.8 pp |
| 2006 Q1 | 6.4 | −5.1 pp |
| 2005 Q4 | 11.5 | +2.9 pp |
| 2005 Q3 | 8.6 | +1.5 pp |
| 2005 Q2 | 7.1 | −2.1 pp |
| 2005 Q1 | 9.2 | −1.0 pp |
| 2004 Q4 | 10.2 | +1.7 pp |
| 2004 Q3 | 8.5 | −3.2 pp |
| 2004 Q2 | 11.7 | +2.3 pp |
| 2004 Q1 | 9.4 | +1.5 pp |
| 2003 Q4 | 7.9 | +1.8 pp |
| 2003 Q3 | 6.1 | +2.9 pp |
| 2003 Q2 | 3.2 | −2.7 pp |
| 2003 Q1 | 5.9 | −6.6 pp |
| 2002 Q4 | 12.5 | +4.8 pp |
| 2002 Q3 | 7.7 | +0.5 pp |
| 2002 Q2 | 7.2 | +9.1 pp |
| 2002 Q1 | −1.9 | +7.5 pp |
| 2001 Q4 | −9.4 | −1.9 pp |
| 2001 Q3 | −7.5 | −1.0 pp |
| 2001 Q2 | −6.5 | −9.3 pp |
| 2001 Q1 | 2.8 | −5.2 pp |
| 2000 Q4 | 8.0 | −0.1 pp |
| 2000 Q3 | 8.1 | +1.0 pp |
| 2000 Q2 | 7.1 | +2.7 pp |
| 2000 Q1 | 4.4 | +3.3 pp |
| 1999 Q4 | 1.1 | +5.2 pp |
| 1999 Q3 | −4.1 | −1.4 pp |
| 1999 Q2 | −2.7 | +3.8 pp |
| 1999 Q1 | −6.5 | −3.1 pp |
| 1998 Q4 | −3.4 | −5.2 pp |
| 1998 Q3 | 1.8 | −0.3 pp |
| 1998 Q2 | 2.1 | −5.7 pp |
| 1998 Q1 | 7.8 | −0.5 pp |
| 1997 Q4 | 8.3 | +0.7 pp |
| 1997 Q3 | 7.6 | +0.1 pp |
| 1997 Q2 | 7.5 | +1.5 pp |
| 1997 Q1 | 6.0 | −1.0 pp |
| 1996 Q4 | 7.0 | +0.5 pp |
| 1996 Q3 | 6.5 | −1.7 pp |
| 1996 Q2 | 8.2 | +1.1 pp |
| 1996 Q1 | 7.1 |
Türkiye and the world (annual) (%)
| Period | Türkiye (TurkStat) | World | Developing countries (low and middle income) | Germany | United States |
|---|---|---|---|---|---|
| 2025 | 3.7 | 2.9 | 4.5 | 0.2 | 2.2 |
| 2024 | 3.5 | 2.9 | 4.4 | −0.5 | 2.8 |
| 2023 | 5.0 | 2.9 | 4.7 | −0.9 | 2.9 |
| 2022 | 5.4 | 3.4 | 4.0 | 1.8 | 2.5 |
| 2021 | 11.8 | 6.5 | 7.4 | 3.9 | 6.2 |
| 2020 | 1.8 | −2.9 | −1.2 | −4.1 | −2.1 |
| 2019 | 1.3 | 2.7 | 4.1 | 1.0 | 2.6 |
| 2018 | 3.5 | 3.3 | 4.9 | 1.1 | 3.0 |
| 2017 | 7.8 | 3.4 | 5.3 | 2.8 | 2.5 |
| 2016 | 3.3 | 2.8 | 4.6 | 2.2 | 1.8 |
| 2015 | 5.8 | 3.1 | 4.7 | 1.7 | 2.9 |
| 2014 | 4.6 | 3.2 | 5.1 | 2.2 | 2.5 |
| 2013 | 8.5 | 2.9 | 5.6 | 0.4 | 2.1 |
| 2012 | 4.8 | 2.7 | 5.5 | 0.5 | 2.3 |
| 2011 | 11.0 | 3.3 | 6.3 | 3.8 | 1.6 |
| 2010 | 8.5 | 4.5 | 8.1 | 4.1 | 2.7 |
| 2009 | −4.9 | −1.3 | 4.0 | −5.5 | −2.6 |
| 2008 | 0.9 | 2.1 | 5.9 | 0.9 | 0.1 |
| 2007 | 5.1 | 4.4 | 8.8 | 2.9 | 2.0 |
| 2006 | 7.1 | 4.5 | 8.2 | 3.9 | 2.8 |
| 2005 | 9.1 | 4.1 | 7.4 | 0.9 | 3.5 |
| 2004 | 9.9 | 4.5 | 7.8 | 1.2 | 3.8 |
| 2003 | 5.8 | 3.1 | 5.8 | −0.5 | 2.8 |
| 2002 | 6.4 | 2.3 | 4.7 | −0.2 | 1.7 |
| 2001 | −5.5 | 2.0 | 3.7 | 1.6 | 1.0 |
| 2000 | 7.0 | 4.6 | 5.6 | 2.9 | 4.1 |
| 1999 | −3.1 | 3.6 | 3.6 | 2.1 | 4.8 |
| 1998 | 1.9 | 2.8 | 3.3 | 2.1 | 4.5 |
| 1997 | 7.4 | 4.0 | 5.7 | 1.9 | 4.4 |
| 1996 | 7.2 | 3.6 | 6.2 | 1.0 | 3.8 |
Related indicators
Growth and incomeGDP per capita (US dollars)
18,103 USD
2025 +17.89%
Gini coefficient (income distribution)
0.410
2025 −0.003 pp
Relative poverty rate (50% of median income)
13.0%
2025 −0.6 pp
Growth expectation (Market Participants Survey, current year GDP growth)
2.88%
November 2026 −0.04 pp
Annual consumer price inflation (CPI)
29.77%
October 2026 +0.04 pp
Monthly inflation (CPI, monthly change)
2.58%
October 2026 +0.74 pp
What does this indicator measure?
Gross domestic product (GDP) is the standard measure of the value added created by the goods and services produced in a country in a given period. The growth rate is the change in GDP adjusted for inflation (chain-linked volume).
The rate on this page is the change in each quarter compared with the same quarter of the previous year. The reference year is 2009=100. The series is taken from 1996 onward from TurkStat's statistical table; the latest quarters are updated from the table of the most recent bulletin.
The rates in the “Türkiye and the world (annual)” view are annual: the change in each year's gross domestic product compared with the previous year, adjusted for inflation (real). The quarterly rate on the main chart is the change in each quarter compared with the same quarter of the previous year. Because the two rates compare different periods, they can differ; the average of a year's four quarterly rates is also not always equal to that year's annual growth.
The Türkiye line is TurkStat's annual GDP data. TurkStat announces the first annual growth estimate for a year with the fourth-quarter bulletin, and the independent annual estimate based on annual data with the Annual Gross Domestic Product bulletin; past years may be revised in later bulletins. On every update the page uses the latest values published by TurkStat.
The lines for the world, developing countries, Germany and the United States come from the World Bank's World Development Indicators (WDI) database (indicator NY.GDP.MKTP.KD.ZG; license CC BY 4.0; values are rounded to one decimal place). The World Bank compiles these data from official national statistics and OECD national accounts data, and some values are World Bank staff estimates; the data are updated on the World Bank's own schedule. As a result, the value the World Bank shows for Türkiye may not yet include TurkStat's latest revisions and may differ from the TurkStat value on this page.
The world and developing country values are weighted averages calculated by the World Bank. For developing countries, the World Bank's “low and middle income” aggregate is used; this aggregate covers the low-income, lower-middle-income and upper-middle-income economies in the World Bank's income classification. Türkiye is upper-middle-income in the World Bank's current classification, so it is also included in this average.
Annual data are published after the year ends, and the latest year appears in the sources at different times; years not yet published are left blank on the chart. Only actual data are included in the comparison; forecast (projection) values are not used.
How to read it
- A positive value shows that the economy produced more than in the same quarter a year earlier.
- In the same bulletin TurkStat also publishes the seasonally and calendar adjusted series and its change on the previous quarter. Because these are different comparisons, the two rates can differ.
- The first published value for each quarter may be revised in later bulletins. This page re-fetches the whole series on every update.
Common misreadings
- The growth rate shows the change in GDP, not its size. A lower rate does not mean the economy shrank; as long as the rate stays above zero, GDP is above the same quarter a year earlier.
- Quarterly growth rates are not the same as the annual growth rate; annual growth is announced separately with TurkStat's annual GDP data.
- The increase in GDP at current prices is not the growth rate; the increase at current prices also includes inflation.
Frequently asked questions
What is Turkey's GDP growth rate?
According to TurkStat, GDP changed by 2.3% in 2026 Q2 compared with the same quarter of the previous year. In the previous quarter (2026 Q1) the rate was 2.6%.
When will the GDP growth figures be announced?
According to TurkStat's release calendar, the next Quarterly Gross Domestic Product bulletin will be published on: Tuesday 1 December 2026, 10:00.
What does chain-linked volume mean?
According to TurkStat's definition, it is the measurement of the change in output with the effect of inflation removed. The ratio of chain-linked volume values to each other gives the real growth rate.
Is year-on-year quarterly growth the same as quarter-on-quarter growth?
No. The rate on this page is a comparison with the same quarter of the previous year. TurkStat also publishes the change in seasonally and calendar adjusted GDP compared with the previous quarter.
Why do growth rates change later?
The first published value is an estimate; as new data arrive, TurkStat revises previous quarters.