Turkey house price index: how much have house prices risen?
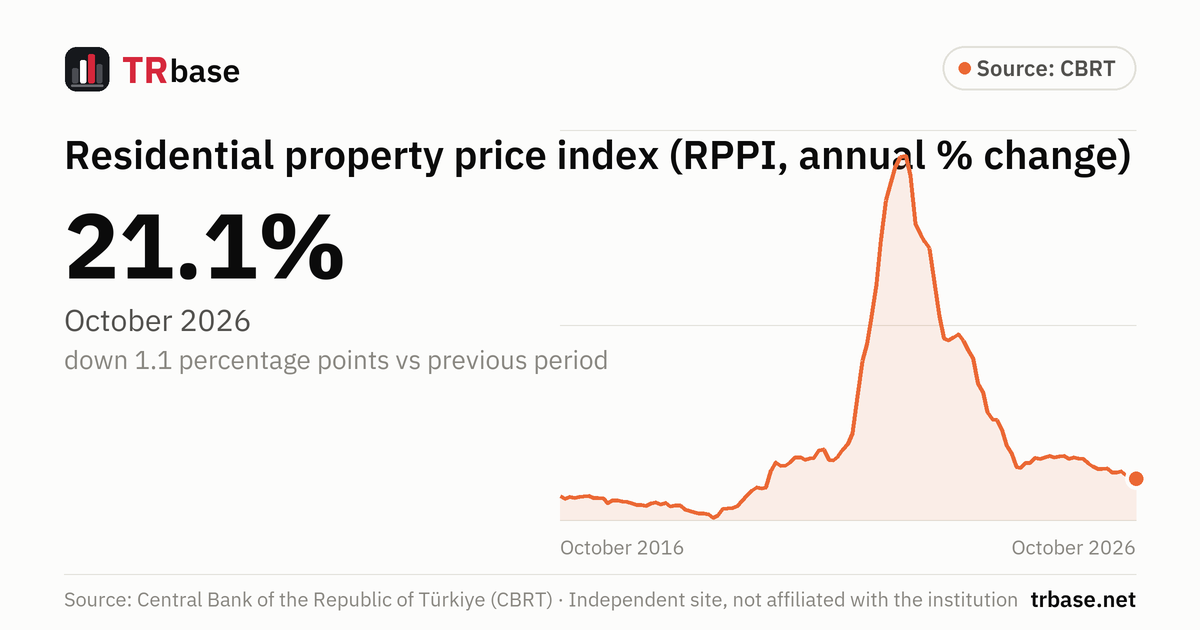
Residential property price index (RPPI, annual % change) · Central Bank of the Republic of Türkiye
Short answer
21.1%
October 2026 −1.1 pp
According to the CBRT's Residential Property Price Index, house prices changed by 21.1% in October 2026 compared with the same month of the previous year (nominal). That is down 1.1 percentage points from the previous month.
- Annual house price growth has fallen for three consecutive months.
- This is the lowest value in the last 24 months.
- A year earlier (October 2025) it was 31.6%; the latest value is 10.5 percentage points lower.
Next release: Wednesday 16 December 2026, 10:00
Residential property price index (RPPI, annual % change), January 2011 – October 2026
Unit: %. Source: Central Bank of the Republic of Türkiye (CBRT). Hover over the chart, or focus it and use the arrow keys.
Data table
All values in the chart, newest first. Unit: %.
| Period | Annual house price growth (%) | Change vs previous period |
|---|---|---|
| October 2026 | 21.1 | −1.1 pp |
| September 2026 | 22.2 | −0.7 pp |
| August 2026 | 22.9 | −2.0 pp |
| July 2026 | 24.9 | +0.5 pp |
| June 2026 | 24.4 | −0.1 pp |
| May 2026 | 24.5 | −2.1 pp |
| April 2026 | 26.6 | +0.4 pp |
| March 2026 | 26.2 | −0.1 pp |
| February 2026 | 26.3 | −1.3 pp |
| January 2026 | 27.6 | −1.4 pp |
| December 2025 | 29.0 | −2.3 pp |
| November 2025 | 31.3 | −0.3 pp |
| October 2025 | 31.6 | −0.6 pp |
| September 2025 | 32.2 | +0.8 pp |
| August 2025 | 31.4 | −1.5 pp |
| July 2025 | 32.9 | +0.1 pp |
| June 2025 | 32.8 | +0.6 pp |
| May 2025 | 32.2 | −0.7 pp |
| April 2025 | 32.9 | +0.7 pp |
| March 2025 | 32.2 | +0.9 pp |
| February 2025 | 31.3 | −0.7 pp |
| January 2025 | 32.0 | +2.6 pp |
| December 2024 | 29.4 | 0.0 pp |
| November 2024 | 29.4 | +2.6 pp |
| October 2024 | 26.8 | −0.6 pp |
| September 2024 | 27.4 | −7.0 pp |
| August 2024 | 34.4 | −4.3 pp |
| July 2024 | 38.7 | −7.7 pp |
| June 2024 | 46.4 | −4.9 pp |
| May 2024 | 51.3 | −0.3 pp |
| April 2024 | 51.6 | −3.7 pp |
| March 2024 | 55.3 | −10.4 pp |
| February 2024 | 65.7 | −4.5 pp |
| January 2024 | 70.2 | −12.9 pp |
| December 2023 | 83.1 | −3.9 pp |
| November 2023 | 87.0 | −4.9 pp |
| October 2023 | 91.9 | −3.4 pp |
| September 2023 | 95.3 | +1.6 pp |
| August 2023 | 93.7 | +1.6 pp |
| July 2023 | 92.1 | −1.0 pp |
| June 2023 | 93.1 | −11.4 pp |
| May 2023 | 104.5 | −17.5 pp |
| April 2023 | 122.0 | −17.3 pp |
| March 2023 | 139.3 | −3.4 pp |
| February 2023 | 142.7 | −4.0 pp |
| January 2023 | 146.7 | −5.2 pp |
| December 2022 | 151.9 | −24.6 pp |
| November 2022 | 176.5 | −10.3 pp |
| October 2022 | 186.8 | +0.4 pp |
| September 2022 | 186.4 | +5.0 pp |
| August 2022 | 181.4 | +8.1 pp |
| July 2022 | 173.3 | +9.3 pp |
| June 2022 | 164.0 | +20.1 pp |
| May 2022 | 143.9 | +23.1 pp |
| April 2022 | 120.8 | +16.5 pp |
| March 2022 | 104.3 | +14.1 pp |
| February 2022 | 90.2 | +8.6 pp |
| January 2022 | 81.6 | +18.1 pp |
| December 2021 | 63.5 | +18.9 pp |
| November 2021 | 44.6 | +5.6 pp |
| October 2021 | 39.0 | +2.6 pp |
| September 2021 | 36.4 | +3.7 pp |
| August 2021 | 32.7 | +2.0 pp |
| July 2021 | 30.7 | −0.3 pp |
| June 2021 | 31.0 | −5.3 pp |
| May 2021 | 36.3 | +0.5 pp |
| April 2021 | 35.8 | +3.9 pp |
| March 2021 | 31.9 | +0.2 pp |
| February 2021 | 31.7 | +0.9 pp |
| January 2021 | 30.8 | −1.3 pp |
| December 2020 | 32.1 | −0.2 pp |
| November 2020 | 32.3 | +2.7 pp |
| October 2020 | 29.6 | +1.4 pp |
| September 2020 | 28.2 | +0.4 pp |
| August 2020 | 27.8 | −1.7 pp |
| July 2020 | 29.5 | +3.9 pp |
| June 2020 | 25.6 | +8.7 pp |
| May 2020 | 16.9 | +0.6 pp |
| April 2020 | 16.3 | −0.5 pp |
| March 2020 | 16.8 | +1.6 pp |
| February 2020 | 15.2 | +2.4 pp |
| January 2020 | 12.8 | +3.0 pp |
| December 2019 | 9.8 | +2.6 pp |
| November 2019 | 7.2 | +0.9 pp |
| October 2019 | 6.3 | +0.2 pp |
| September 2019 | 6.1 | +0.4 pp |
| August 2019 | 5.7 | +3.2 pp |
| July 2019 | 2.5 | +1.3 pp |
| June 2019 | 1.2 | −1.8 pp |
| May 2019 | 3.0 | −0.5 pp |
| April 2019 | 3.5 | 0.0 pp |
| March 2019 | 3.5 | −0.6 pp |
| February 2019 | 4.1 | −0.6 pp |
| January 2019 | 4.7 | −0.8 pp |
| December 2018 | 5.5 | −2.0 pp |
| November 2018 | 7.5 | −0.1 pp |
| October 2018 | 7.6 | +0.6 pp |
| September 2018 | 7.0 | −1.8 pp |
| August 2018 | 8.8 | +0.6 pp |
| July 2018 | 8.2 | −0.9 pp |
| June 2018 | 9.1 | +0.4 pp |
| May 2018 | 8.7 | +1.3 pp |
| April 2018 | 7.4 | −0.4 pp |
| March 2018 | 7.8 | −0.1 pp |
| February 2018 | 7.9 | −0.7 pp |
| January 2018 | 8.6 | −0.8 pp |
| December 2017 | 9.4 | −0.1 pp |
| November 2017 | 9.5 | −0.7 pp |
| October 2017 | 10.2 | 0.0 pp |
| September 2017 | 10.2 | +1.5 pp |
| August 2017 | 8.7 | −2.5 pp |
| July 2017 | 11.2 | −0.2 pp |
| June 2017 | 11.4 | 0.0 pp |
| May 2017 | 11.4 | −1.0 pp |
| April 2017 | 12.4 | +0.1 pp |
| March 2017 | 12.3 | +0.3 pp |
| February 2017 | 12.0 | +0.5 pp |
| January 2017 | 11.5 | −0.4 pp |
| December 2016 | 11.9 | +0.9 pp |
| November 2016 | 11.0 | −1.1 pp |
| October 2016 | 12.1 | −0.3 pp |
| September 2016 | 12.4 | −0.8 pp |
| August 2016 | 13.2 | +1.3 pp |
| July 2016 | 11.9 | −0.3 pp |
| June 2016 | 12.2 | −1.0 pp |
| May 2016 | 13.2 | +0.2 pp |
| April 2016 | 13.0 | −0.4 pp |
| March 2016 | 13.4 | −0.9 pp |
| February 2016 | 14.3 | −1.0 pp |
| January 2016 | 15.3 | +0.2 pp |
| December 2015 | 15.1 | −1.4 pp |
| November 2015 | 16.5 | +1.2 pp |
| October 2015 | 15.3 | 0.0 pp |
| September 2015 | 15.3 | +0.2 pp |
| August 2015 | 15.1 | −1.0 pp |
| July 2015 | 16.1 | −0.9 pp |
| June 2015 | 17.0 | +0.8 pp |
| May 2015 | 16.2 | −0.4 pp |
| April 2015 | 16.6 | +1.0 pp |
| March 2015 | 15.6 | 0.0 pp |
| February 2015 | 15.6 | +0.9 pp |
| January 2015 | 14.7 | +1.3 pp |
| December 2014 | 13.4 | −0.5 pp |
| November 2014 | 13.9 | +0.9 pp |
| October 2014 | 13.0 | −0.8 pp |
| September 2014 | 13.8 | +1.4 pp |
| August 2014 | 12.4 | +0.3 pp |
| July 2014 | 12.1 | +0.4 pp |
| June 2014 | 11.7 | −0.1 pp |
| May 2014 | 11.8 | −0.1 pp |
| April 2014 | 11.9 | +0.1 pp |
| March 2014 | 11.8 | 0.0 pp |
| February 2014 | 11.8 | −0.1 pp |
| January 2014 | 11.9 | −0.8 pp |
| December 2013 | 12.7 | +0.7 pp |
| November 2013 | 12.0 | −0.4 pp |
| October 2013 | 12.4 | +1.4 pp |
| September 2013 | 11.0 | −0.4 pp |
| August 2013 | 11.4 | −0.1 pp |
| July 2013 | 11.5 | 0.0 pp |
| June 2013 | 11.5 | +0.5 pp |
| May 2013 | 11.0 | +0.2 pp |
| April 2013 | 10.8 | −0.9 pp |
| March 2013 | 11.7 | +1.2 pp |
| February 2013 | 10.5 | +0.1 pp |
| January 2013 | 10.4 | −2.0 pp |
| December 2012 | 12.4 | +1.8 pp |
| November 2012 | 10.6 | +0.3 pp |
| October 2012 | 10.3 | −1.9 pp |
| September 2012 | 12.2 | +0.2 pp |
| August 2012 | 12.0 | −0.4 pp |
| July 2012 | 12.4 | +2.1 pp |
| June 2012 | 10.3 | −0.3 pp |
| May 2012 | 10.6 | +0.5 pp |
| April 2012 | 10.1 | +0.5 pp |
| March 2012 | 9.6 | −0.5 pp |
| February 2012 | 10.1 | −0.1 pp |
| January 2012 | 10.2 | +2.4 pp |
| December 2011 | 7.8 | −1.1 pp |
| November 2011 | 8.9 | −1.8 pp |
| October 2011 | 10.7 | +2.3 pp |
| September 2011 | 8.4 | −0.2 pp |
| August 2011 | 8.6 | −0.4 pp |
| July 2011 | 9.0 | −0.8 pp |
| June 2011 | 9.8 | +1.0 pp |
| May 2011 | 8.8 | −0.1 pp |
| April 2011 | 8.9 | −0.3 pp |
| March 2011 | 9.2 | +0.9 pp |
| February 2011 | 8.3 | +1.1 pp |
| January 2011 | 7.2 |
Türkiye and the three largest cities (%)
| Period | Annual house price growth | Istanbul (TR10) | Ankara (TR51) | Izmir (TR31) |
|---|---|---|---|---|
| October 2026 | 21.1 | 24.8 | 22.7 | 17.9 |
| September 2026 | 22.2 | 26.6 | 21.9 | 20.9 |
| August 2026 | 22.9 | 26.1 | 24.8 | 23.1 |
| July 2026 | 24.9 | 27.7 | 26.5 | 22.8 |
| June 2026 | 24.4 | 25.1 | 25.6 | 22.6 |
| May 2026 | 24.5 | 25.3 | 27.2 | 22.9 |
| April 2026 | 26.6 | 26.1 | 29.9 | 26.7 |
| March 2026 | 26.2 | 27.6 | 30.3 | 24.2 |
| February 2026 | 26.3 | 27.9 | 29.6 | 25.6 |
| January 2026 | 27.6 | 28.6 | 31.7 | 28.9 |
| December 2025 | 29.0 | 28.5 | 34.9 | 30.5 |
| November 2025 | 31.3 | 31.6 | 37.9 | 31.5 |
| October 2025 | 31.6 | 32.4 | 38.4 | 30.9 |
| September 2025 | 32.2 | 30.6 | 41.2 | 34.2 |
| August 2025 | 31.4 | 30.2 | 41.2 | 31.6 |
| July 2025 | 32.9 | 33.5 | 43.1 | 31.1 |
| June 2025 | 32.8 | 32.6 | 42.2 | 32.0 |
| May 2025 | 32.2 | 32.5 | 41.2 | 31.1 |
| April 2025 | 32.9 | 34.4 | 42.1 | 30.7 |
| March 2025 | 32.2 | 30.4 | 38.7 | 32.6 |
| February 2025 | 31.3 | 28.6 | 37.2 | 32.9 |
| January 2025 | 32.0 | 29.6 | 36.9 | 29.6 |
| December 2024 | 29.4 | 26.5 | 34.5 | 25.3 |
| November 2024 | 29.4 | 26.3 | 34.8 | 26.6 |
| October 2024 | 26.8 | 21.4 | 32.7 | 28.7 |
| September 2024 | 27.4 | 23.4 | 30.6 | 23.2 |
| August 2024 | 34.4 | 27.3 | 35.6 | 32.4 |
| July 2024 | 38.7 | 26.8 | 39.6 | 36.9 |
| June 2024 | 46.4 | 36.3 | 47.2 | 42.5 |
| May 2024 | 51.3 | 36.5 | 52.5 | 48.0 |
| April 2024 | 51.6 | 36.7 | 55.3 | 48.9 |
| March 2024 | 55.3 | 39.8 | 65.3 | 49.8 |
| February 2024 | 65.7 | 49.2 | 78.5 | 55.1 |
| January 2024 | 70.2 | 52.4 | 84.9 | 67.2 |
| December 2023 | 83.1 | 65.8 | 95.3 | 82.0 |
| November 2023 | 87.0 | 69.5 | 98.9 | 85.8 |
| October 2023 | 91.9 | 75.6 | 100.2 | 85.1 |
| September 2023 | 95.3 | 76.5 | 109.3 | 95.4 |
| August 2023 | 93.7 | 79.7 | 106.6 | 95.8 |
| July 2023 | 92.1 | 80.0 | 100.7 | 93.8 |
| June 2023 | 93.1 | 78.9 | 106.0 | 103.0 |
| May 2023 | 104.5 | 97.2 | 118.4 | 106.9 |
| April 2023 | 122.0 | 115.5 | 132.0 | 126.8 |
| March 2023 | 139.3 | 138.5 | 143.1 | 148.5 |
| February 2023 | 142.7 | 145.1 | 147.1 | 149.6 |
| January 2023 | 146.7 | 151.1 | 150.5 | 151.2 |
| December 2022 | 151.9 | 165.0 | 162.6 | 153.0 |
| November 2022 | 176.5 | 195.0 | 188.4 | 177.1 |
| October 2022 | 186.8 | 213.9 | 204.3 | 184.2 |
| September 2022 | 186.4 | 220.8 | 198.5 | 182.2 |
| August 2022 | 181.4 | 217.6 | 195.6 | 165.2 |
| July 2022 | 173.3 | 207.3 | 193.0 | 157.2 |
| June 2022 | 164.0 | 198.3 | 174.7 | 149.2 |
| May 2022 | 143.9 | 172.0 | 152.9 | 134.8 |
| April 2022 | 120.8 | 141.5 | 129.7 | 112.6 |
| March 2022 | 104.3 | 118.2 | 112.4 | 94.5 |
| February 2022 | 90.2 | 100.2 | 96.5 | 84.9 |
| January 2022 | 81.6 | 91.0 | 87.4 | 75.2 |
| December 2021 | 63.5 | 68.3 | 62.9 | 58.0 |
| November 2021 | 44.6 | 45.5 | 40.9 | 41.9 |
| October 2021 | 39.0 | 36.6 | 35.2 | 38.7 |
| September 2021 | 36.4 | 32.4 | 34.2 | 37.6 |
| August 2021 | 32.7 | 27.4 | 27.9 | 34.6 |
| July 2021 | 30.7 | 27.4 | 25.4 | 34.2 |
| June 2021 | 31.0 | 27.8 | 28.0 | 32.7 |
| May 2021 | 36.3 | 30.5 | 33.9 | 40.2 |
| April 2021 | 35.8 | 30.5 | 32.7 | 40.2 |
| March 2021 | 31.9 | 28.2 | 27.7 | 35.7 |
| February 2021 | 31.7 | 28.6 | 27.9 | 33.8 |
| January 2021 | 30.8 | 27.3 | 25.7 | 32.0 |
| December 2020 | 32.1 | 27.8 | 29.1 | 34.8 |
| November 2020 | 32.3 | 28.6 | 32.9 | 34.5 |
| October 2020 | 29.6 | 27.3 | 29.0 | 31.4 |
| September 2020 | 28.2 | 25.8 | 25.6 | 27.5 |
| August 2020 | 27.8 | 26.3 | 27.0 | 30.0 |
| July 2020 | 29.5 | 24.1 | 32.2 | 30.9 |
| June 2020 | 25.6 | 21.6 | 27.9 | 26.3 |
| May 2020 | 16.9 | 13.4 | 15.3 | 19.4 |
| April 2020 | 16.3 | 13.1 | 16.9 | 17.2 |
| March 2020 | 16.8 | 14.3 | 16.2 | 19.6 |
| February 2020 | 15.2 | 10.6 | 16.0 | 18.8 |
| January 2020 | 12.8 | 7.6 | 10.0 | 15.7 |
| December 2019 | 9.8 | 4.9 | 10.7 | 13.1 |
| November 2019 | 7.2 | 1.1 | 9.2 | 6.1 |
| October 2019 | 6.3 | −0.3 | 5.3 | 11.2 |
| September 2019 | 6.1 | 0.4 | 7.2 | 5.1 |
| August 2019 | 5.7 | −0.7 | 7.6 | 5.2 |
| July 2019 | 2.5 | −1.3 | 1.9 | 2.8 |
| June 2019 | 1.2 | −4.2 | −0.4 | 1.9 |
| May 2019 | 3.0 | −1.7 | 4.2 | 1.9 |
| April 2019 | 3.5 | −0.8 | 3.5 | 3.7 |
| March 2019 | 3.5 | −2.0 | 5.0 | 3.2 |
| February 2019 | 4.1 | −0.2 | 3.8 | 4.4 |
| January 2019 | 4.7 | 0.4 | 8.5 | 6.3 |
| December 2018 | 5.5 | 1.6 | 5.0 | 6.2 |
| November 2018 | 7.5 | 5.1 | 4.4 | 12.3 |
| October 2018 | 7.6 | 4.5 | 8.4 | 8.8 |
| September 2018 | 7.0 | 1.9 | 6.5 | 12.6 |
| August 2018 | 8.8 | 3.9 | 7.7 | 15.6 |
| July 2018 | 8.2 | 2.7 | 7.5 | 14.3 |
| June 2018 | 9.1 | 3.5 | 7.7 | 18.7 |
| May 2018 | 8.7 | 3.7 | 7.4 | 15.5 |
| April 2018 | 7.4 | 1.6 | 5.5 | 15.6 |
| March 2018 | 7.8 | 2.6 | 6.3 | 17.3 |
| February 2018 | 7.9 | 3.6 | 5.5 | 15.9 |
| January 2018 | 8.6 | 4.0 | 7.6 | 16.6 |
| December 2017 | 9.4 | 5.1 | 7.2 | 19.4 |
| November 2017 | 9.5 | 5.3 | 6.9 | 19.6 |
| October 2017 | 10.2 | 6.9 | 7.0 | 19.2 |
| September 2017 | 10.2 | 7.5 | 7.3 | 18.9 |
| August 2017 | 8.7 | 4.4 | 7.3 | 17.4 |
| July 2017 | 11.2 | 8.7 | 9.0 | 20.3 |
| June 2017 | 11.4 | 9.5 | 10.0 | 15.8 |
| May 2017 | 11.4 | 9.3 | 9.6 | 19.8 |
| April 2017 | 12.4 | 11.3 | 10.6 | 18.7 |
| March 2017 | 12.3 | 11.6 | 10.9 | 17.2 |
| February 2017 | 12.0 | 11.5 | 10.1 | 17.3 |
| January 2017 | 11.5 | 11.2 | 8.2 | 15.8 |
| December 2016 | 11.9 | 12.2 | 8.6 | 17.2 |
| November 2016 | 11.0 | 10.4 | 10.1 | 13.8 |
| October 2016 | 12.1 | 12.6 | 10.6 | 13.6 |
| September 2016 | 12.4 | 15.1 | 9.3 | 17.6 |
| August 2016 | 13.2 | 17.3 | 10.0 | 14.3 |
| July 2016 | 11.9 | 15.2 | 7.8 | 14.7 |
| June 2016 | 12.2 | 14.9 | 8.9 | 15.1 |
| May 2016 | 13.2 | 16.6 | 9.3 | 15.6 |
| April 2016 | 13.0 | 18.3 | 7.8 | 15.1 |
| March 2016 | 13.4 | 19.5 | 8.1 | 15.0 |
| February 2016 | 14.3 | 21.2 | 10.0 | 16.2 |
| January 2016 | 15.3 | 23.3 | 11.1 | 16.3 |
| December 2015 | 15.1 | 22.7 | 11.4 | 13.9 |
| November 2015 | 16.5 | 26.5 | 11.1 | 18.6 |
| October 2015 | 15.3 | 25.7 | 9.6 | 16.2 |
| September 2015 | 15.3 | 23.2 | 10.3 | 15.5 |
| August 2015 | 15.1 | 24.2 | 10.3 | 16.5 |
| July 2015 | 16.1 | 25.6 | 11.5 | 15.7 |
| June 2015 | 17.0 | 27.7 | 11.0 | 18.6 |
| May 2015 | 16.2 | 28.1 | 11.9 | 13.5 |
| April 2015 | 16.6 | 27.1 | 11.7 | 15.6 |
| March 2015 | 15.6 | 23.9 | 10.4 | 14.7 |
| February 2015 | 15.6 | 23.9 | 11.2 | 13.1 |
| January 2015 | 14.7 | 24.1 | 9.9 | 15.1 |
| December 2014 | 13.4 | 22.0 | 9.1 | 11.6 |
| November 2014 | 13.9 | 21.6 | 9.5 | 12.2 |
| October 2014 | 13.0 | 19.3 | 9.8 | 13.0 |
| September 2014 | 13.8 | 22.7 | 10.2 | 12.8 |
| August 2014 | 12.4 | 20.9 | 9.3 | 11.1 |
| July 2014 | 12.1 | 19.8 | 8.8 | 12.4 |
| June 2014 | 11.7 | 18.9 | 9.3 | 9.5 |
| May 2014 | 11.8 | 18.0 | 7.6 | 13.0 |
| April 2014 | 11.9 | 17.1 | 10.5 | 11.3 |
| March 2014 | 11.8 | 19.2 | 9.6 | 12.8 |
| February 2014 | 11.8 | 19.8 | 9.7 | 13.5 |
| January 2014 | 11.9 | 18.4 | 10.2 | 12.2 |
| December 2013 | 12.7 | 18.5 | 10.7 | 14.2 |
| November 2013 | 12.0 | 18.0 | 10.9 | 12.4 |
| October 2013 | 12.4 | 17.5 | 9.2 | 13.3 |
| September 2013 | 11.0 | 15.1 | 9.7 | 11.4 |
| August 2013 | 11.4 | 15.2 | 8.3 | 12.3 |
| July 2013 | 11.5 | 14.5 | 9.4 | 10.7 |
| June 2013 | 11.5 | 17.1 | 8.2 | 12.3 |
| May 2013 | 11.0 | 14.0 | 9.5 | 10.9 |
| April 2013 | 10.8 | 14.3 | 8.3 | 11.1 |
| March 2013 | 11.7 | 14.3 | 10.3 | 11.0 |
| February 2013 | 10.5 | 11.6 | 9.4 | 11.4 |
| January 2013 | 10.4 | 11.8 | 9.7 | 9.5 |
| December 2012 | 12.4 | 14.6 | 11.4 | 11.2 |
| November 2012 | 10.6 | 10.7 | 8.5 | 9.4 |
| October 2012 | 10.3 | 12.0 | 9.5 | 7.1 |
| September 2012 | 12.2 | 13.3 | 9.6 | 9.9 |
| August 2012 | 12.0 | 12.3 | 9.2 | 9.5 |
| July 2012 | 12.4 | 14.5 | 9.3 | 11.5 |
| June 2012 | 10.3 | 9.0 | 9.5 | 8.4 |
| May 2012 | 10.6 | 11.9 | 9.5 | 9.2 |
| April 2012 | 10.1 | 10.9 | 8.6 | 8.9 |
| March 2012 | 9.6 | 11.1 | 6.8 | 8.0 |
| February 2012 | 10.1 | 11.4 | 6.5 | 8.1 |
| January 2012 | 10.2 | 11.1 | 7.4 | 7.6 |
| December 2011 | 7.8 | 9.0 | 5.4 | 7.8 |
| November 2011 | 8.9 | 10.7 | 7.1 | 9.3 |
| October 2011 | 10.7 | 12.6 | 10.1 | 13.2 |
| September 2011 | 8.4 | 10.1 | 6.1 | 9.7 |
| August 2011 | 8.6 | 10.3 | 8.7 | 10.2 |
| July 2011 | 9.0 | 10.8 | 7.8 | 9.6 |
| June 2011 | 9.8 | 11.9 | 8.4 | 10.8 |
| May 2011 | 8.8 | 10.8 | 6.7 | 8.8 |
| April 2011 | 8.9 | 11.5 | 7.7 | 9.7 |
| March 2011 | 9.2 | 11.4 | 9.4 | 9.3 |
| February 2011 | 8.3 | 9.9 | 8.5 | 6.7 |
| January 2011 | 7.2 | 8.7 | 8.5 | 8.0 |
Index level (index)
| Period | Residential Property Price Index (Türkiye) |
|---|---|
| October 2026 | 240.9 |
| September 2026 | 239.2 |
| August 2026 | 236.5 |
| July 2026 | 234.6 |
| June 2026 | 231.3 |
| May 2026 | 227.0 |
| April 2026 | 223.3 |
| March 2026 | 219.5 |
| February 2026 | 215.4 |
| January 2026 | 211.7 |
| December 2025 | 204.4 |
| November 2025 | 204.0 |
| October 2025 | 198.9 |
| September 2025 | 195.7 |
| August 2025 | 192.4 |
| July 2025 | 187.8 |
| June 2025 | 186.0 |
| May 2025 | 182.3 |
| April 2025 | 176.4 |
| March 2025 | 173.9 |
| February 2025 | 170.6 |
| January 2025 | 165.9 |
| December 2024 | 158.5 |
| November 2024 | 155.4 |
| October 2024 | 151.1 |
| September 2024 | 148.0 |
| August 2024 | 146.5 |
| July 2024 | 141.3 |
| June 2024 | 140.0 |
| May 2024 | 137.9 |
| April 2024 | 132.7 |
| March 2024 | 131.5 |
| February 2024 | 129.9 |
| January 2024 | 125.7 |
| December 2023 | 122.4 |
| November 2023 | 120.1 |
| October 2023 | 119.2 |
| September 2023 | 116.2 |
| August 2023 | 109.0 |
| July 2023 | 101.9 |
| June 2023 | 95.7 |
| May 2023 | 91.1 |
| April 2023 | 87.5 |
| March 2023 | 84.7 |
| February 2023 | 78.4 |
| January 2023 | 73.9 |
| December 2022 | 66.8 |
| November 2022 | 64.2 |
| October 2022 | 62.1 |
| September 2022 | 59.5 |
| August 2022 | 56.3 |
| July 2022 | 53.0 |
| June 2022 | 49.5 |
| May 2022 | 44.6 |
| April 2022 | 39.4 |
| March 2022 | 35.4 |
| February 2022 | 32.3 |
| January 2022 | 29.9 |
| December 2021 | 26.5 |
| November 2021 | 23.2 |
| October 2021 | 21.6 |
| September 2021 | 20.8 |
| August 2021 | 20.0 |
| July 2021 | 19.4 |
| June 2021 | 18.8 |
| May 2021 | 18.3 |
| April 2021 | 17.9 |
| March 2021 | 17.3 |
| February 2021 | 17.0 |
| January 2021 | 16.5 |
| December 2020 | 16.2 |
| November 2020 | 16.1 |
| October 2020 | 15.6 |
| September 2020 | 15.2 |
| August 2020 | 15.1 |
| July 2020 | 14.8 |
| June 2020 | 14.3 |
| May 2020 | 13.4 |
| April 2020 | 13.2 |
| March 2020 | 13.1 |
| February 2020 | 12.9 |
| January 2020 | 12.6 |
| December 2019 | 12.3 |
| November 2019 | 12.1 |
| October 2019 | 12.0 |
| September 2019 | 11.9 |
| August 2019 | 11.8 |
| July 2019 | 11.5 |
| June 2019 | 11.4 |
| May 2019 | 11.5 |
| April 2019 | 11.3 |
| March 2019 | 11.2 |
| February 2019 | 11.2 |
| January 2019 | 11.2 |
| December 2018 | 11.2 |
| November 2018 | 11.3 |
| October 2018 | 11.3 |
| September 2018 | 11.2 |
| August 2018 | 11.1 |
| July 2018 | 11.2 |
| June 2018 | 11.3 |
| May 2018 | 11.1 |
| April 2018 | 10.9 |
| March 2018 | 10.9 |
| February 2018 | 10.8 |
| January 2018 | 10.7 |
| December 2017 | 10.6 |
| November 2017 | 10.5 |
| October 2017 | 10.5 |
| September 2017 | 10.5 |
| August 2017 | 10.2 |
| July 2017 | 10.3 |
| June 2017 | 10.3 |
| May 2017 | 10.2 |
| April 2017 | 10.2 |
| March 2017 | 10.1 |
| February 2017 | 10.0 |
| January 2017 | 9.8 |
| December 2016 | 9.7 |
| November 2016 | 9.6 |
| October 2016 | 9.5 |
| September 2016 | 9.5 |
| August 2016 | 9.4 |
| July 2016 | 9.3 |
| June 2016 | 9.3 |
| May 2016 | 9.2 |
| April 2016 | 9.1 |
| March 2016 | 9.0 |
| February 2016 | 8.9 |
| January 2016 | 8.8 |
| December 2015 | 8.7 |
| November 2015 | 8.7 |
| October 2015 | 8.5 |
| September 2015 | 8.4 |
| August 2015 | 8.3 |
| July 2015 | 8.3 |
| June 2015 | 8.3 |
| May 2015 | 8.1 |
| April 2015 | 8.0 |
| March 2015 | 7.9 |
| February 2015 | 7.8 |
| January 2015 | 7.7 |
| December 2014 | 7.5 |
| November 2014 | 7.4 |
| October 2014 | 7.4 |
| September 2014 | 7.3 |
| August 2014 | 7.2 |
| July 2014 | 7.2 |
| June 2014 | 7.1 |
| May 2014 | 7.0 |
| April 2014 | 6.9 |
| March 2014 | 6.8 |
| February 2014 | 6.7 |
| January 2014 | 6.7 |
| December 2013 | 6.6 |
| November 2013 | 6.5 |
| October 2013 | 6.5 |
| September 2013 | 6.4 |
| August 2013 | 6.4 |
| July 2013 | 6.4 |
| June 2013 | 6.3 |
| May 2013 | 6.2 |
| April 2013 | 6.2 |
| March 2013 | 6.1 |
| February 2013 | 6.0 |
| January 2013 | 6.0 |
| December 2012 | 5.9 |
| November 2012 | 5.8 |
| October 2012 | 5.8 |
| September 2012 | 5.8 |
| August 2012 | 5.8 |
| July 2012 | 5.7 |
| June 2012 | 5.7 |
| May 2012 | 5.6 |
| April 2012 | 5.5 |
| March 2012 | 5.5 |
| February 2012 | 5.5 |
| January 2012 | 5.4 |
| December 2011 | 5.2 |
| November 2011 | 5.3 |
| October 2011 | 5.3 |
| September 2011 | 5.2 |
| August 2011 | 5.2 |
| July 2011 | 5.1 |
| June 2011 | 5.1 |
| May 2011 | 5.1 |
| April 2011 | 5.0 |
| March 2011 | 5.0 |
| February 2011 | 5.0 |
| January 2011 | 4.9 |
| December 2010 | 4.9 |
| November 2010 | 4.8 |
| October 2010 | 4.8 |
| September 2010 | 4.8 |
| August 2010 | 4.7 |
| July 2010 | 4.7 |
| June 2010 | 4.7 |
| May 2010 | 4.7 |
| April 2010 | 4.6 |
| March 2010 | 4.6 |
| February 2010 | 4.6 |
| January 2010 | 4.6 |
Related indicators
HousingHouse sales (monthly)
131,072
October 2026 −7.95%
House sales to foreigners (monthly)
2,259
October 2026 +4.25%
Dwelling units in buildings granted construction permits (quarterly)
280,463
2026 Q2 +19.68%
New tenant rent index (annual % change)
24.5%
October 2026 −2.2 pp
US dollar exchange rate (CBRT forex buying)
50.4028 TRY
20 November 2026 +0.05%
Euro exchange rate (CBRT forex buying)
55.2974 TRY
20 November 2026 −0.11%
What does this indicator measure?
The Residential Property Price Index (RPPI) is the index the CBRT calculates every month to track changes in house prices across Türkiye. It is calculated with the hedonic regression method: the effect of the observable characteristics (quality) of dwellings is removed, so that the price change of dwellings with the same characteristics is measured.
According to the CBRT's metadata, the data source is the appraisal reports prepared by real estate appraisal companies for banks when individuals apply for housing loans. The loan does not have to be used; all appraised dwellings are covered.
The main value on this page is the percent change of the index from the same month of the previous year (nominal); it is calculated from the index level (2023=100) the CBRT publishes on EVDS and rounded to one decimal. The index starts in 2010, so the annual change is given from 2011 onward.
According to the CBRT's metadata, first results are published about 15 days after the reference month and final results about 45 days after; the latest month may change in the next release.
How to read it
- The annual change is the percent change of the index from its value in the same month of the previous year.
- The value is nominal. In its bulletin the CBRT also gives the same change adjusted by the CPI (real); the real change is not on this page.
- The change in the table is the difference in percentage points of the annual rate from the previous month.
- The "Türkiye and the three largest cities" view shows the annual changes of the Istanbul, Ankara and Izmir regional indices.
Common misreadings
- The index is not the average price of dwellings sold; it is calculated from the values in appraisal reports, with the quality effect removed.
- A fall in the annual rate does not mean that house prices fell; prices may be rising more slowly.
- The number of house sales is a separate TurkStat statistic; this index measures price changes, not the number of sales.
Frequently asked questions
How much have house prices risen in Turkey?
According to the CBRT's Residential Property Price Index, house prices changed by 21.1% in October 2026 compared with the same month of the previous year. In the previous month (September 2026) the annual change was 22.2%.
When will the next house price index be released?
According to the CBRT's release calendar, the next Residential Property Price Index release is on Wednesday 16 December 2026, 10:00.
How is the house price index calculated?
Dwelling values in the appraisal reports prepared for housing loan applications are used. The CBRT removes differences arising from the characteristics of dwellings with the hedonic regression method and aggregates the regional indices to Türkiye using the number of households and average dwelling values as weights.
What is the real change in house prices?
It is the nominal change adjusted by consumer inflation (CPI). The CBRT gives the real change in its bulletin every month; this page shows the nominal annual change.
How much have house prices risen in Istanbul, Ankara and Izmir?
The "Türkiye and the three largest cities" view on the chart shows the annual changes of the regional indices for these three cities. Besides Türkiye as a whole, the CBRT publishes indices for 19 regions.
By month
- October 2026
- September 2026
- August 2026
- July 2026
- June 2026
- May 2026
- April 2026
- March 2026
- February 2026
- January 2026
- December 2025
- November 2025
- October 2025
- September 2025
- August 2025
- July 2025
- June 2025
- May 2025
- April 2025
- March 2025
- February 2025
- January 2025
- December 2024
- November 2024
- October 2024
- September 2024
- August 2024
- July 2024
- June 2024
- May 2024
- April 2024
- March 2024
- February 2024
- January 2024
- December 2023
- November 2023