Turkey building permits
Dwelling units in buildings granted construction permits (quarterly) · Turkish Statistical Institute
Short answer
280,463
2026 Q2 +19.68%
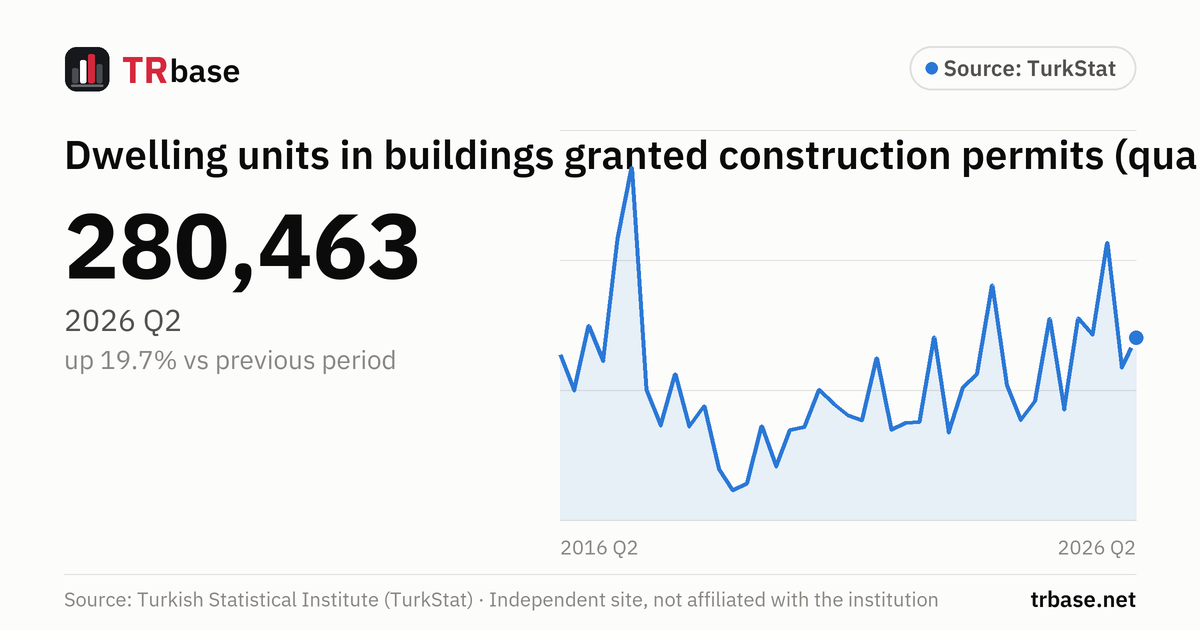
According to TurkStat, construction permits were granted for 280,463 dwelling units in 2026 Q2. That is up 19.7% from the previous quarter.
- A year earlier (2025 Q2) it was 310,017; the latest value is 9.53% lower.
Next release: Tuesday 24 November 2026, 10:00
Dwelling units in buildings granted construction permits (quarterly), 2010 Q1 – 2026 Q2
Unit: number. Source: Turkish Statistical Institute (TurkStat). Hover over the chart, or focus it and use the arrow keys.
Data table
All values in the chart, newest first. Unit: number.
| Period | Building permits (dwellings) (number) | Change vs previous period |
|---|---|---|
| 2026 Q2 | 280,463 | +19.68% |
| 2026 Q1 | 234,350 | −45.06% |
| 2025 Q4 | 426,544 | +49.49% |
| 2025 Q3 | 285,342 | −7.96% |
| 2025 Q2 | 310,017 | +82.84% |
| 2025 Q1 | 169,554 | −45.23% |
| 2024 Q4 | 309,589 | +69.13% |
| 2024 Q3 | 183,051 | +19.12% |
| 2024 Q2 | 153,673 | −25.97% |
| 2024 Q1 | 207,580 | −42.47% |
| 2023 Q4 | 360,848 | +60.11% |
| 2023 Q3 | 225,382 | +10.33% |
| 2023 Q2 | 204,276 | +52.09% |
| 2023 Q1 | 134,316 | −52.27% |
| 2022 Q4 | 281,418 | +85.96% |
| 2022 Q3 | 151,333 | +0.98% |
| 2022 Q2 | 149,860 | +7.82% |
| 2022 Q1 | 138,986 | −44.09% |
| 2021 Q4 | 248,601 | +62.02% |
| 2021 Q3 | 153,440 | −4.78% |
| 2021 Q2 | 161,142 | −10.07% |
| 2021 Q1 | 179,181 | −10.53% |
| 2020 Q4 | 200,277 | +39.73% |
| 2020 Q3 | 143,329 | +3.47% |
| 2020 Q2 | 138,516 | +69.73% |
| 2020 Q1 | 81,611 | −43.56% |
| 2019 Q4 | 144,598 | +156.52% |
| 2019 Q3 | 56,369 | +24.00% |
| 2019 Q2 | 45,459 | −42.08% |
| 2019 Q1 | 78,489 | −55.06% |
| 2018 Q4 | 174,643 | +21.55% |
| 2018 Q3 | 143,684 | −35.87% |
| 2018 Q2 | 224,060 | +54.66% |
| 2018 Q1 | 144,877 | −27.70% |
| 2017 Q4 | 200,393 | −63.04% |
| 2017 Q3 | 542,201 | +25.24% |
| 2017 Q2 | 432,922 | +77.33% |
| 2017 Q1 | 244,134 | −18.22% |
| 2016 Q4 | 298,534 | +49.96% |
| 2016 Q3 | 199,077 | −21.73% |
| 2016 Q2 | 254,337 | −4.43% |
| 2016 Q1 | 266,134 | +4.14% |
| 2015 Q4 | 255,562 | +20.47% |
| 2015 Q3 | 212,143 | −14.93% |
| 2015 Q2 | 249,362 | +32.18% |
| 2015 Q1 | 188,655 | −8.66% |
| 2014 Q4 | 206,550 | −13.93% |
| 2014 Q3 | 239,991 | −16.96% |
| 2014 Q2 | 289,016 | −3.45% |
| 2014 Q1 | 299,354 | +29.48% |
| 2013 Q4 | 231,203 | +15.06% |
| 2013 Q3 | 200,943 | −18.50% |
| 2013 Q2 | 246,556 | +50.99% |
| 2013 Q1 | 163,294 | −27.24% |
| 2012 Q4 | 224,429 | +27.62% |
| 2012 Q3 | 175,860 | −21.18% |
| 2012 Q2 | 223,105 | +48.82% |
| 2012 Q1 | 149,915 | −31.78% |
| 2011 Q4 | 219,743 | +38.14% |
| 2011 Q3 | 159,069 | −3.50% |
| 2011 Q2 | 164,837 | +50.17% |
| 2011 Q1 | 109,770 | −74.47% |
| 2010 Q4 | 430,020 | +156.73% |
| 2010 Q3 | 167,499 | −8.14% |
| 2010 Q2 | 182,347 | +40.40% |
| 2010 Q1 | 129,880 |
Construction and occupancy (number)
| Period | Building permits (dwellings) | Occupancy permit (iskân) |
|---|---|---|
| 2026 Q2 | 280,463 | 144,150 |
| 2026 Q1 | 234,350 | 163,290 |
| 2025 Q4 | 426,544 | 257,824 |
| 2025 Q3 | 285,342 | 156,440 |
| 2025 Q2 | 310,017 | 130,263 |
| 2025 Q1 | 169,554 | 148,211 |
| 2024 Q4 | 309,589 | 231,177 |
| 2024 Q3 | 183,051 | 127,086 |
| 2024 Q2 | 153,673 | 89,557 |
| 2024 Q1 | 207,580 | 188,338 |
| 2023 Q4 | 360,848 | 186,575 |
| 2023 Q3 | 225,382 | 116,865 |
| 2023 Q2 | 204,276 | 109,321 |
| 2023 Q1 | 134,316 | 126,375 |
| 2022 Q4 | 281,418 | 201,727 |
| 2022 Q3 | 151,333 | 141,178 |
| 2022 Q2 | 149,860 | 150,455 |
| 2022 Q1 | 138,986 | 158,663 |
| 2021 Q4 | 248,601 | 210,828 |
| 2021 Q3 | 153,440 | 141,573 |
| 2021 Q2 | 161,142 | 122,421 |
| 2021 Q1 | 179,181 | 161,320 |
| 2020 Q4 | 200,277 | 178,003 |
| 2020 Q3 | 143,329 | 156,851 |
| 2020 Q2 | 138,516 | 117,365 |
| 2020 Q1 | 81,611 | 156,439 |
| 2019 Q4 | 144,598 | 197,282 |
| 2019 Q3 | 56,369 | 151,504 |
| 2019 Q2 | 45,459 | 148,807 |
| 2019 Q1 | 78,489 | 252,497 |
| 2018 Q4 | 174,643 | 282,973 |
| 2018 Q3 | 143,684 | 209,657 |
| 2018 Q2 | 224,060 | 205,857 |
| 2018 Q1 | 144,877 | 209,117 |
| 2017 Q4 | 200,393 | 258,867 |
| 2017 Q3 | 542,201 | 184,953 |
| 2017 Q2 | 432,922 | 195,753 |
| 2017 Q1 | 244,134 | 198,108 |
| 2016 Q4 | 298,534 | 245,545 |
| 2016 Q3 | 199,077 | 158,871 |
| 2016 Q2 | 254,337 | 189,692 |
| 2016 Q1 | 266,134 | 165,771 |
| 2015 Q4 | 255,562 | 211,007 |
| 2015 Q3 | 212,143 | 167,321 |
| 2015 Q2 | 249,362 | 195,151 |
| 2015 Q1 | 188,655 | 162,194 |
| 2014 Q4 | 206,550 | 199,835 |
| 2014 Q3 | 239,991 | 154,635 |
| 2014 Q2 | 289,016 | 161,002 |
| 2014 Q1 | 299,354 | 264,657 |
| 2013 Q4 | 231,203 | 215,875 |
| 2013 Q3 | 200,943 | 192,782 |
| 2013 Q2 | 246,556 | 164,963 |
| 2013 Q1 | 163,294 | 154,336 |
| 2012 Q4 | 224,429 | 177,373 |
| 2012 Q3 | 175,860 | 127,458 |
| 2012 Q2 | 223,105 | 132,959 |
| 2012 Q1 | 149,915 | 119,413 |
| 2011 Q4 | 219,743 | 166,077 |
| 2011 Q3 | 159,069 | 141,142 |
| 2011 Q2 | 164,837 | 145,248 |
| 2011 Q1 | 109,770 | 106,521 |
| 2010 Q4 | 430,020 | 136,230 |
| 2010 Q3 | 167,499 | 104,299 |
| 2010 Q2 | 182,347 | 97,053 |
| 2010 Q1 | 129,880 | 92,751 |
Related indicators
HousingHouse sales (monthly)
131,072
October 2026 −7.95%
House sales to foreigners (monthly)
2,259
October 2026 +4.25%
Residential property price index (RPPI, annual % change)
21.1%
October 2026 −1.1 pp
New tenant rent index (annual % change)
24.5%
October 2026 −2.2 pp
Annual consumer price inflation (CPI)
29.77%
October 2026 +0.04 pp
Monthly inflation (CPI, monthly change)
2.58%
October 2026 +0.74 pp
What does this indicator measure?
As TurkStat's metadata states, a construction permit is the document required under Article 21 of the Zoning Law No. 3194 for buildings whose construction is about to start; in short, it is a permit to build. The figure on this page is the total number of dwelling units in buildings granted construction permits during the quarter.
An occupancy permit (iskân), by contrast, is obtained under Article 30 of the same law for buildings that are fully or partly completed. The "Construction and occupancy" view in the chart shows the dwelling units for both permits together.
According to TurkStat, the data source is administrative records in the building documents module of the Spatial Address Registration System (MAKS) of the General Directorate of Population and Citizenship Affairs. The quarterly series on this page starts in 2010.
How to read it
- Quarterly figures are seasonal; it is useful to compare a quarter with the same quarter of the previous year. TurkStat's headline also gives the change on the same quarter of the previous year.
- In the same bulletin TurkStat also publishes the number of buildings and the floor area.
Common misreadings
- Not all dwellings granted a construction permit are built in the same period; a permit is permission to start construction and does not show completed buildings.
- The number of dwellings granted permits is not the same as house sales or house prices.
- TurkStat may revise building permit data retroactively; first published figures can differ from the current values on this page.
Frequently asked questions
How many building permits were granted in Turkey?
According to TurkStat, construction permits were granted for 280,463 dwelling units in 2026 Q2. In the previous quarter (2026 Q1) the number was 234,350.
What is the difference between a construction permit and an occupancy permit?
A construction permit is obtained before construction starts. An occupancy permit (iskân) is obtained for buildings that are fully or partly completed.
When will building permit statistics be released?
TurkStat releases building permit statistics quarterly. Next release in the calendar: Tuesday 24 November 2026, 10:00.
Where do the data come from?
According to TurkStat, from administrative records in the building documents module of the Spatial Address Registration System (MAKS) of the General Directorate of Population and Citizenship Affairs.