Turkey construction cost index
Construction cost index (annual change) · Turkish Statistical Institute
Short answer
30.80%
September 2026 +1.21 pp
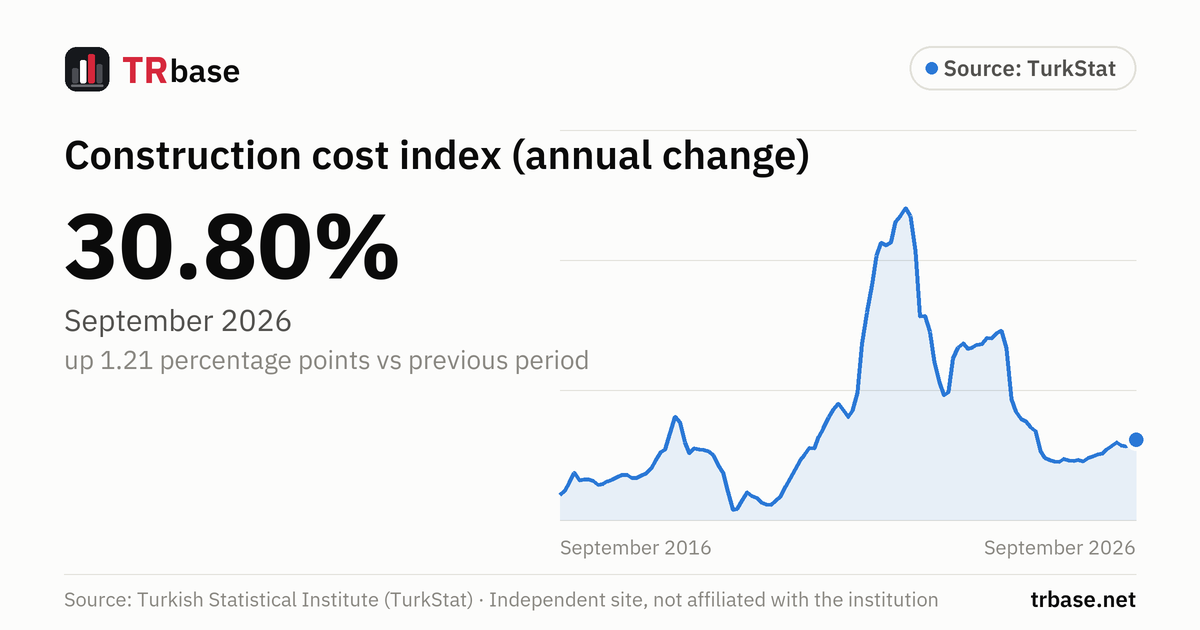
TurkStat's construction cost index changed by 30.80% in September 2026 compared with the same month of the previous year. That is up 1.21 percentage points from the previous month.
- Construction cost increase has risen for two consecutive months.
- A year earlier (September 2025) it was 23.18%; the latest value is 7.62 percentage points higher.
Next release: Wednesday 9 December 2026, 10:00
Construction cost index (annual change), January 2015 – September 2026
Unit: %. Source: Turkish Statistical Institute (TurkStat). Hover over the chart, or focus it and use the arrow keys.
Data table
All values in the chart, newest first. Unit: %.
| Period | Construction cost increase (%) | Change vs previous period |
|---|---|---|
| September 2026 | 30.80 | +1.21 pp |
| August 2026 | 29.59 | +1.26 pp |
| July 2026 | 28.33 | −0.33 pp |
| June 2026 | 28.66 | −1.18 pp |
| May 2026 | 29.84 | +1.26 pp |
| April 2026 | 28.58 | +1.34 pp |
| March 2026 | 27.24 | +1.52 pp |
| February 2026 | 25.72 | +0.34 pp |
| January 2026 | 25.38 | +0.88 pp |
| December 2025 | 24.50 | +0.57 pp |
| November 2025 | 23.93 | +1.36 pp |
| October 2025 | 22.57 | −0.61 pp |
| September 2025 | 23.18 | +0.36 pp |
| August 2025 | 22.82 | −0.16 pp |
| July 2025 | 22.98 | −0.60 pp |
| June 2025 | 23.58 | +1.18 pp |
| May 2025 | 22.40 | −0.29 pp |
| April 2025 | 22.69 | −0.54 pp |
| March 2025 | 23.23 | −0.71 pp |
| February 2025 | 23.94 | −2.67 pp |
| January 2025 | 26.61 | −7.66 pp |
| December 2024 | 34.27 | −1.66 pp |
| November 2024 | 35.93 | −2.01 pp |
| October 2024 | 37.94 | −0.99 pp |
| September 2024 | 38.93 | −2.61 pp |
| August 2024 | 41.54 | −4.81 pp |
| July 2024 | 46.35 | −19.77 pp |
| June 2024 | 66.12 | −6.66 pp |
| May 2024 | 72.78 | +0.98 pp |
| April 2024 | 71.80 | +1.82 pp |
| March 2024 | 69.98 | −0.07 pp |
| February 2024 | 70.05 | +2.18 pp |
| January 2024 | 67.87 | +0.56 pp |
| December 2023 | 67.31 | +0.82 pp |
| November 2023 | 66.49 | +0.56 pp |
| October 2023 | 65.93 | −2.00 pp |
| September 2023 | 67.93 | +1.47 pp |
| August 2023 | 66.46 | +4.21 pp |
| July 2023 | 62.25 | +12.93 pp |
| June 2023 | 49.32 | +1.37 pp |
| May 2023 | 47.95 | −5.04 pp |
| April 2023 | 52.99 | −7.71 pp |
| March 2023 | 60.70 | −11.67 pp |
| February 2023 | 72.37 | −6.15 pp |
| January 2023 | 78.52 | +0.12 pp |
| December 2022 | 78.40 | −25.07 pp |
| November 2022 | 103.47 | −13.60 pp |
| October 2022 | 117.07 | −2.76 pp |
| September 2022 | 119.83 | +2.85 pp |
| August 2022 | 116.98 | +2.24 pp |
| July 2022 | 114.74 | +7.87 pp |
| June 2022 | 106.87 | +1.14 pp |
| May 2022 | 105.73 | −0.87 pp |
| April 2022 | 106.60 | +5.03 pp |
| March 2022 | 101.57 | +11.30 pp |
| February 2022 | 90.27 | +10.36 pp |
| January 2022 | 79.91 | +12.17 pp |
| December 2021 | 67.74 | +18.87 pp |
| November 2021 | 48.87 | +6.94 pp |
| October 2021 | 41.93 | +2.39 pp |
| September 2021 | 39.54 | −2.59 pp |
| August 2021 | 42.13 | −2.63 pp |
| July 2021 | 44.76 | +2.28 pp |
| June 2021 | 42.48 | +2.92 pp |
| May 2021 | 39.56 | +4.08 pp |
| April 2021 | 35.48 | +3.51 pp |
| March 2021 | 31.97 | +4.38 pp |
| February 2021 | 27.59 | −0.23 pp |
| January 2021 | 27.82 | +2.80 pp |
| December 2020 | 25.02 | +2.03 pp |
| November 2020 | 22.99 | +3.50 pp |
| October 2020 | 19.49 | +3.38 pp |
| September 2020 | 16.11 | +3.07 pp |
| August 2020 | 13.04 | +3.87 pp |
| July 2020 | 9.17 | +1.70 pp |
| June 2020 | 7.47 | +1.67 pp |
| May 2020 | 5.80 | −0.34 pp |
| April 2020 | 6.14 | −0.78 pp |
| March 2020 | 6.92 | −1.57 pp |
| February 2020 | 8.49 | −0.82 pp |
| January 2020 | 9.31 | −1.45 pp |
| December 2019 | 10.76 | +3.14 pp |
| November 2019 | 7.62 | +3.35 pp |
| October 2019 | 4.27 | +0.25 pp |
| September 2019 | 4.02 | −6.77 pp |
| August 2019 | 10.79 | −7.63 pp |
| July 2019 | 18.42 | −2.68 pp |
| June 2019 | 21.10 | −3.76 pp |
| May 2019 | 24.86 | −1.55 pp |
| April 2019 | 26.41 | −0.54 pp |
| March 2019 | 26.95 | −0.27 pp |
| February 2019 | 27.22 | −0.32 pp |
| January 2019 | 27.54 | +1.89 pp |
| December 2018 | 25.65 | −4.30 pp |
| November 2018 | 29.95 | −7.57 pp |
| October 2018 | 37.52 | −2.14 pp |
| September 2018 | 39.66 | +6.30 pp |
| August 2018 | 33.36 | +6.35 pp |
| July 2018 | 27.01 | +0.95 pp |
| June 2018 | 26.06 | +3.02 pp |
| May 2018 | 23.04 | +3.13 pp |
| April 2018 | 19.91 | +1.99 pp |
| March 2018 | 17.92 | +0.72 pp |
| February 2018 | 17.20 | +0.98 pp |
| January 2018 | 16.22 | +0.04 pp |
| December 2017 | 16.18 | −1.31 pp |
| November 2017 | 17.49 | +0.07 pp |
| October 2017 | 17.42 | +0.71 pp |
| September 2017 | 16.71 | +0.97 pp |
| August 2017 | 15.74 | +0.82 pp |
| July 2017 | 14.92 | +1.07 pp |
| June 2017 | 13.85 | +0.34 pp |
| May 2017 | 13.51 | −1.53 pp |
| April 2017 | 15.04 | −0.54 pp |
| March 2017 | 15.58 | −0.12 pp |
| February 2017 | 15.70 | +0.45 pp |
| January 2017 | 15.25 | −2.94 pp |
| December 2016 | 18.19 | +3.52 pp |
| November 2016 | 14.67 | +3.35 pp |
| October 2016 | 11.32 | +1.60 pp |
| September 2016 | 9.72 | −0.69 pp |
| August 2016 | 10.41 | −0.19 pp |
| July 2016 | 10.60 | −0.97 pp |
| June 2016 | 11.57 | −0.35 pp |
| May 2016 | 11.92 | +0.70 pp |
| April 2016 | 11.22 | −0.10 pp |
| March 2016 | 11.32 | +0.60 pp |
| February 2016 | 10.72 | −0.67 pp |
| January 2016 | 11.39 | +6.86 pp |
| December 2015 | 4.53 | −0.06 pp |
| November 2015 | 4.59 | +0.67 pp |
| October 2015 | 3.92 | −1.02 pp |
| September 2015 | 4.94 | +0.40 pp |
| August 2015 | 4.54 | +0.03 pp |
| July 2015 | 4.51 | −0.66 pp |
| June 2015 | 5.17 | −0.23 pp |
| May 2015 | 5.40 | +1.18 pp |
| April 2015 | 4.22 | +1.21 pp |
| March 2015 | 3.01 | −0.09 pp |
| February 2015 | 3.10 | −0.43 pp |
| January 2015 | 3.53 |
Related indicators
Prices and inflationAnnual consumer price inflation (CPI)
29.77%
October 2026 +0.04 pp
Monthly inflation (CPI, monthly change)
2.58%
October 2026 +0.74 pp
Domestic Producer Price Index (D-PPI, annual change)
27.41%
October 2026 +0.03 pp
Core inflation (special CPI aggregate C, annual)
28.28%
October 2026 −0.42 pp
Food inflation (food and non-alcoholic beverages, annual)
27.73%
October 2026 +0.11 pp
Rent inflation (CPI rent, annual)
39.71%
October 2026 −1.63 pp
What does this indicator measure?
The construction cost index is an input price index that measures the change in construction costs for buildings and non-building structures, broken down into labor and material. The reference year is 2015=100.
The rate on this page is the percent change in the total index (buildings and non-building structures, material and labor combined) compared with the same month of the previous year. The series starts in 2015.
According to TurkStat, the calculation uses D-PPI values for materials other than fuel and electricity, and CPI values for fuel and electricity.
How to read it
- The index tracks the input cost of construction; a rise shows that the labor and material cost needed to build the same structure has increased.
- In the same bulletin TurkStat also publishes separate indices for building and non-building construction and for material and labor; these can differ from the total rate.
Common misreadings
- The construction cost index does not measure house prices or rents; it measures only the input cost of construction.
- The index is not a sale price that includes land cost, contractor profit and taxes.
- This page shows the annual change; the monthly change and the index values are also in the TurkStat bulletin.
Frequently asked questions
What is the construction cost index in Turkey?
According to TurkStat, the construction cost index changed by 30.80% in September 2026 compared with the same month of the previous year. In the previous month (August 2026) the rate was 29.59%.
When will the construction cost index be announced?
According to TurkStat's release calendar, the next Construction Cost Index bulletin will be published on: Wednesday 9 December 2026, 10:00.
What does the construction cost index measure?
It measures the change in the cost of the material and labor used in buildings and non-building structures.
Is the construction cost index a house price index?
No. The index tracks the input cost of construction. The change in house prices is a different indicator.
Why is it released two months later?
TurkStat publishes the construction cost index for a month in the second month after it; for example, the September 2026 index was released on November 10, 2026.
By month
- September 2026
- August 2026
- July 2026
- June 2026
- May 2026
- April 2026
- March 2026
- February 2026
- January 2026
- December 2025
- November 2025
- October 2025
- September 2025
- August 2025
- July 2025
- June 2025
- May 2025
- April 2025
- March 2025
- February 2025
- January 2025
- December 2024
- November 2024
- October 2024
- September 2024
- August 2024
- July 2024
- June 2024
- May 2024
- April 2024
- March 2024
- February 2024
- January 2024
- December 2023
- November 2023
- October 2023