Turkey corporate bond and debt instrument issuance
Debt instrument issuance (monthly sales amount) · Capital Markets Board of Türkiye
Short answer
71.4 billion TRY
October 2026 −63.25%
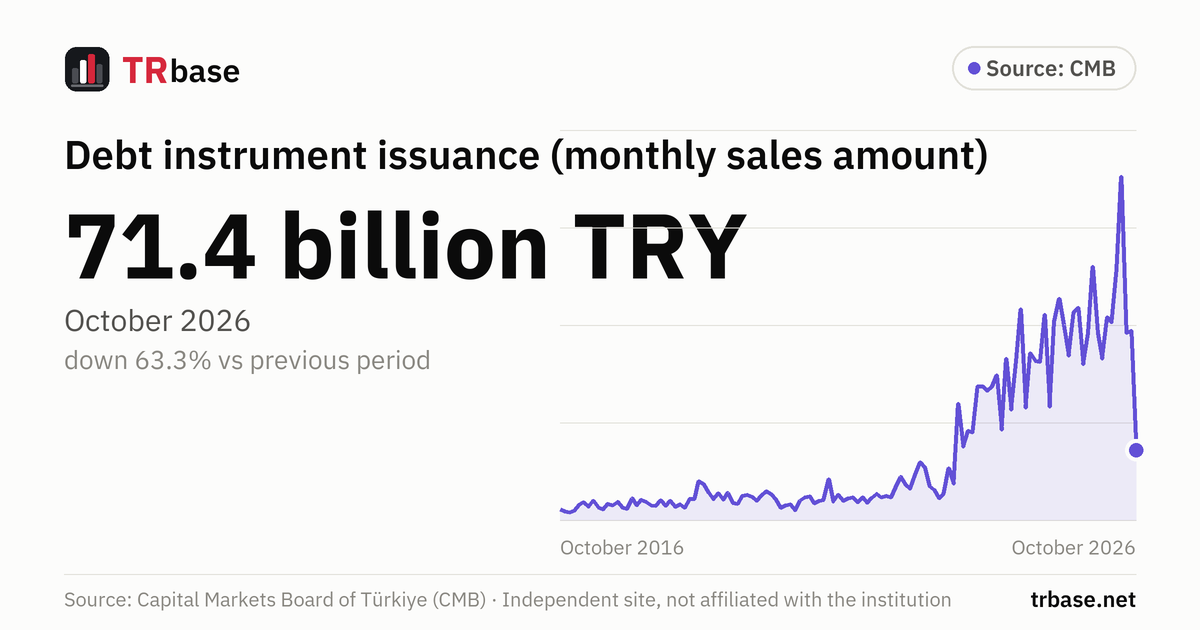
According to CMB data, the total nominal amount of debt instrument issues sold in October 2026 was 71.4 billion TRY. That is down 63.3% from the previous month.
- This is the lowest value in the last 24 months.
- A year earlier (October 2025) it was 217.7 billion TRY; the latest value is 67.2% lower.
Debt instrument issuance (monthly sales amount), January 2013 – October 2026
Unit: TRY million. Source: Capital Markets Board of Türkiye (CMB). Hover over the chart, or focus it and use the arrow keys.
Data table
All values in the chart, newest first. Unit: TRY million (as published by the institution).
| Period | Debt issuance (TRY million) | Change vs previous period |
|---|---|---|
| October 2026 | 71,352 | −63.25% |
| September 2026 | 194,160 | +1.03% |
| August 2026 | 192,178 | −45.43% |
| July 2026 | 352,146 | +36.79% |
| June 2026 | 257,435 | +26.97% |
| May 2026 | 202,750 | −2.43% |
| April 2026 | 207,800 | +25.46% |
| March 2026 | 165,624 | −13.55% |
| February 2026 | 191,578 | −26.29% |
| January 2026 | 259,916 | +35.42% |
| December 2025 | 191,929 | +20.05% |
| November 2025 | 159,872 | −26.57% |
| October 2025 | 217,719 | +2.09% |
| September 2025 | 213,261 | +26.59% |
| August 2025 | 168,470 | −15.83% |
| July 2025 | 200,164 | −11.76% |
| June 2025 | 226,830 | +11.47% |
| May 2025 | 203,498 | +74.85% |
| April 2025 | 116,386 | −44.73% |
| March 2025 | 210,584 | +29.86% |
| February 2025 | 162,158 | −0.82% |
| January 2025 | 163,500 | −4.46% |
| December 2024 | 171,139 | +48.94% |
| November 2024 | 114,903 | −46.83% |
| October 2024 | 216,100 | +32.69% |
| September 2024 | 162,858 | +44.31% |
| August 2024 | 112,856 | −31.69% |
| July 2024 | 165,206 | +78.57% |
| June 2024 | 92,518 | −37.61% |
| May 2024 | 148,282 | +8.13% |
| April 2024 | 137,127 | +3.62% |
| March 2024 | 132,338 | −3.42% |
| February 2024 | 137,022 | −0.09% |
| January 2024 | 137,152 | +52.09% |
| December 2023 | 90,179 | −1.36% |
| November 2023 | 91,419 | +21.53% |
| October 2023 | 75,227 | −36.91% |
| September 2023 | 119,239 | +220.22% |
| August 2023 | 37,236 | −29.71% |
| July 2023 | 52,972 | +95.06% |
| June 2023 | 27,156 | +22.06% |
| May 2023 | 22,249 | −28.23% |
| April 2023 | 31,000 | −11.26% |
| March 2023 | 34,935 | −35.28% |
| February 2023 | 53,978 | −9.07% |
| January 2023 | 59,360 | +28.18% |
| December 2022 | 46,310 | +44.25% |
| November 2022 | 32,104 | −11.44% |
| October 2022 | 36,249 | −18.15% |
| September 2022 | 44,285 | +31.43% |
| August 2022 | 33,695 | +45.85% |
| July 2022 | 23,103 | −7.89% |
| June 2022 | 25,083 | +7.11% |
| May 2022 | 23,417 | −13.67% |
| April 2022 | 27,125 | +18.52% |
| March 2022 | 22,885 | +29.64% |
| February 2022 | 17,654 | −24.19% |
| January 2022 | 23,285 | +27.53% |
| December 2021 | 18,259 | −22.35% |
| November 2021 | 23,515 | +6.51% |
| October 2021 | 22,078 | +12.47% |
| September 2021 | 19,630 | −23.58% |
| August 2021 | 25,686 | +38.25% |
| July 2021 | 18,579 | −55.61% |
| June 2021 | 41,856 | +102.16% |
| May 2021 | 20,704 | +4.01% |
| April 2021 | 19,906 | +15.85% |
| March 2021 | 17,182 | −29.48% |
| February 2021 | 24,364 | +4.15% |
| January 2021 | 23,392 | +15.16% |
| December 2020 | 20,313 | +103.34% |
| November 2020 | 9,990 | −38.49% |
| October 2020 | 16,241 | +6.18% |
| September 2020 | 15,296 | +23.31% |
| August 2020 | 12,404 | −42.09% |
| July 2020 | 21,421 | −18.90% |
| June 2020 | 26,412 | −11.18% |
| May 2020 | 29,735 | +17.06% |
| April 2020 | 25,403 | +30.32% |
| March 2020 | 19,492 | −17.97% |
| February 2020 | 23,762 | −7.42% |
| January 2020 | 25,668 | +2.19% |
| December 2019 | 25,117 | +52.54% |
| November 2019 | 16,466 | −6.94% |
| October 2019 | 17,693 | −36.76% |
| September 2019 | 27,978 | +35.28% |
| August 2019 | 20,682 | −25.29% |
| July 2019 | 27,682 | +29.13% |
| June 2019 | 21,437 | −23.15% |
| May 2019 | 27,895 | −23.86% |
| April 2019 | 36,638 | −8.28% |
| March 2019 | 39,946 | +84.63% |
| February 2019 | 21,635 | −0.09% |
| January 2019 | 21,654 | +73.16% |
| December 2018 | 12,505 | −22.43% |
| November 2018 | 16,122 | +16.54% |
| October 2018 | 13,834 | −29.68% |
| September 2018 | 19,674 | +33.23% |
| August 2018 | 14,767 | −26.20% |
| July 2018 | 20,008 | +37.73% |
| June 2018 | 14,527 | −5.01% |
| May 2018 | 15,294 | −18.40% |
| April 2018 | 18,742 | −9.70% |
| March 2018 | 20,756 | +37.39% |
| February 2018 | 15,108 | −32.90% |
| January 2018 | 22,514 | +91.30% |
| December 2017 | 11,769 | −9.43% |
| November 2017 | 12,994 | −30.39% |
| October 2017 | 18,668 | +22.51% |
| September 2017 | 15,237 | −7.29% |
| August 2017 | 16,435 | +47.55% |
| July 2017 | 11,138 | −15.69% |
| June 2017 | 13,211 | −33.67% |
| May 2017 | 19,918 | +46.97% |
| April 2017 | 13,552 | −25.58% |
| March 2017 | 18,210 | +15.04% |
| February 2017 | 15,829 | +60.76% |
| January 2017 | 9,846 | +26.61% |
| December 2016 | 7,777 | −13.49% |
| November 2016 | 8,990 | −19.72% |
| October 2016 | 11,198 | +10.06% |
| September 2016 | 10,174 | −14.66% |
| August 2016 | 11,922 | −23.02% |
| July 2016 | 15,487 | +8.45% |
| June 2016 | 14,281 | +6.12% |
| May 2016 | 13,457 | −5.88% |
| April 2016 | 14,297 | +19.96% |
| March 2016 | 11,918 | +46.29% |
| February 2016 | 8,147 | +8.98% |
| January 2016 | 7,476 | −8.40% |
| December 2015 | 8,161 | −25.12% |
| November 2015 | 10,899 | +4.52% |
| October 2015 | 10,428 | +4.23% |
| September 2015 | 10,004 | −4.78% |
| August 2015 | 10,507 | +56.33% |
| July 2015 | 6,721 | −57.59% |
| June 2015 | 15,850 | +81.71% |
| May 2015 | 8,723 | −2.62% |
| April 2015 | 8,957 | −27.18% |
| March 2015 | 12,301 | −7.76% |
| February 2015 | 13,335 | +101.13% |
| January 2015 | 6,630 | −37.08% |
| December 2014 | 10,538 | −16.84% |
| November 2014 | 12,671 | −9.91% |
| October 2014 | 14,064 | +24.50% |
| September 2014 | 11,296 | +35.47% |
| August 2014 | 8,338 | −8.67% |
| July 2014 | 9,130 | −38.77% |
| June 2014 | 14,910 | +84.43% |
| May 2014 | 8,084 | −28.68% |
| April 2014 | 11,335 | +69.48% |
| March 2014 | 6,688 | +21.56% |
| February 2014 | 5,502 | +13.01% |
| January 2014 | 4,868 | −48.08% |
| December 2013 | 9,376 | +20.53% |
| November 2013 | 7,779 | −14.65% |
| October 2013 | 9,115 | +70.24% |
| September 2013 | 5,354 | −10.98% |
| August 2013 | 6,014 | +34.80% |
| July 2013 | 4,462 | +22.06% |
| June 2013 | 3,655 | −56.04% |
| May 2013 | 8,314 | −23.35% |
| April 2013 | 10,847 | +137.23% |
| March 2013 | 4,572 | −26.35% |
| February 2013 | 6,208 | +0.33% |
| January 2013 | 6,188 |
Related indicators
Capital marketsNet purchases of equities by non-residents (weekly)
246.8 USD mn
13 November 2026 −120.4 USD mn
Number of stock market investors
6,541,435
October 2026 −2.27%
Number of foreign investors in the stock market
32,978
October 2026 −1.27%
Number of IPOs (annual)
36
2026 (Ocak–Ekim)
Number of listed companies
626
October 2026 0.00%
Number of investment fund investors
5,801,428
October 2026 +0.04%
What does this indicator measure?
This indicator is the domestic and foreign total of debt instrument issues sold during the month concerned. According to the CMB's definition, debt instruments cover issues of commercial paper, corporate bonds, convertible bonds, subordinated debt instruments and structured debt instruments.
Amounts are based on nominal value and are published by the CMB in TRY million. Other instruments such as lease certificates and asset-backed securities are shown separately in the CMB table and are not included in this total. The Treasury's government domestic debt securities are not among the instrument types the CMB counts.
How to read it
- This is flow data: each month shows only the issues sold during that month, not the total stock of debt instruments outstanding.
- Monthly amounts can fluctuate sharply depending on the timing of large issues; to see the trend, follow several months together.
- Amounts are in TRY and not adjusted for inflation; keep this in mind when comparing over long periods.
Common misreadings
- The issue ceiling approved by the CMB and the amount actually sold are not the same thing. According to the CMB, the approved ceiling is the maximum nominal amount that can be sold within one year from the approval date; this page shows only the amount actually sold.
- The issue amount in a month does not mean companies' total debt increased by that much; debt instruments maturing in the same period may have been repaid.
The data on this page are for information only and are not investment advice.
Frequently asked questions
How much debt was issued in October 2026?
According to CMB data, the total nominal amount of debt instrument issues sold in October 2026 was 71.4 billion TRY. In the previous month (September 2026) it was 194.2 billion TRY.
Which instruments are included?
Commercial paper, corporate bonds, convertible bonds, subordinated debt instruments and structured debt instruments. Lease certificates and other capital market instruments are not included.
Are issues abroad included?
Yes. The CMB also publishes domestic and foreign issues separately; the amount on this page is their total.
What is the difference between the approved issue ceiling and this amount?
The approved ceiling is the maximum amount the issuer can sell within one year from approval. The amount on this page is the nominal value of debt instruments actually sold in the month concerned.
When are the data updated?
According to the CMB, Issuance Data are released on a monthly basis; for the current month, data as of one day before the date the report is generated are shown. Our site shows only completed months. According to TurkStat's National Data Release Calendar, the CMB's next monthly release for this data set is on not yet announced.