Turkey food inflation
Food inflation (food and non-alcoholic beverages, annual) · Turkish Statistical Institute
Short answer
27.73%
October 2026 +0.11 pp
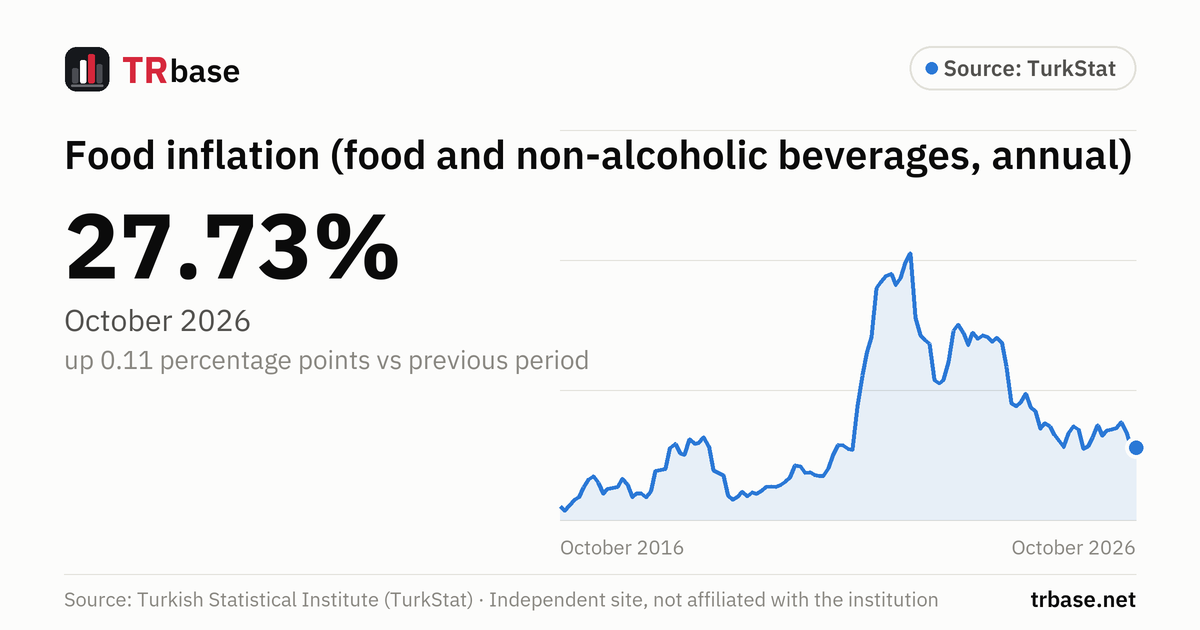
Annual price growth in the food and non-alcoholic beverages group of the CPI (food inflation) in Türkiye was 27.73% in October 2026. That is up 0.11 percentage points from the previous month.
- A year earlier (October 2025) it was 34.87%; the latest value is 7.14 percentage points lower.
Next release: Thursday 3 December 2026, 10:00
Food inflation (food and non-alcoholic beverages, annual), January 2005 – October 2026
Unit: %. Source: Turkish Statistical Institute (TurkStat). Hover over the chart, or focus it and use the arrow keys.
Data table
All values in the chart, newest first. Unit: %.
| Period | Food inflation (%) | Change vs previous period |
|---|---|---|
| October 2026 | 27.73 | +0.11 pp |
| September 2026 | 27.62 | −6.17 pp |
| August 2026 | 33.79 | −3.73 pp |
| July 2026 | 37.52 | +2.08 pp |
| June 2026 | 35.44 | +0.58 pp |
| May 2026 | 34.86 | +0.31 pp |
| April 2026 | 34.55 | +2.19 pp |
| March 2026 | 32.36 | −4.09 pp |
| February 2026 | 36.45 | +4.76 pp |
| January 2026 | 31.69 | +3.38 pp |
| December 2025 | 28.31 | +0.87 pp |
| November 2025 | 27.44 | −7.43 pp |
| October 2025 | 34.87 | −1.19 pp |
| September 2025 | 36.06 | +2.78 pp |
| August 2025 | 33.28 | +5.33 pp |
| July 2025 | 27.95 | −2.25 pp |
| June 2025 | 30.20 | −2.67 pp |
| May 2025 | 32.87 | −3.22 pp |
| April 2025 | 36.09 | −1.03 pp |
| March 2025 | 37.12 | +2.01 pp |
| February 2025 | 35.11 | −6.65 pp |
| January 2025 | 41.76 | −1.82 pp |
| December 2024 | 43.58 | −4.99 pp |
| November 2024 | 48.57 | +3.29 pp |
| October 2024 | 45.28 | +1.56 pp |
| September 2024 | 43.72 | −1.16 pp |
| August 2024 | 44.88 | −14.03 pp |
| July 2024 | 58.91 | −9.17 pp |
| June 2024 | 68.08 | −2.06 pp |
| May 2024 | 70.14 | +1.64 pp |
| April 2024 | 68.50 | −1.91 pp |
| March 2024 | 70.41 | −0.71 pp |
| February 2024 | 71.12 | +1.41 pp |
| January 2024 | 69.71 | −2.30 pp |
| December 2023 | 72.01 | +4.85 pp |
| November 2023 | 67.16 | −4.83 pp |
| October 2023 | 71.99 | −3.15 pp |
| September 2023 | 75.14 | +2.28 pp |
| August 2023 | 72.86 | +12.14 pp |
| July 2023 | 60.72 | +6.80 pp |
| June 2023 | 53.92 | +1.40 pp |
| May 2023 | 52.52 | −1.40 pp |
| April 2023 | 53.92 | −13.97 pp |
| March 2023 | 67.89 | −1.44 pp |
| February 2023 | 69.33 | −1.67 pp |
| January 2023 | 71.00 | −6.87 pp |
| December 2022 | 77.87 | −24.68 pp |
| November 2022 | 102.55 | +3.50 pp |
| October 2022 | 99.05 | +6.00 pp |
| September 2022 | 93.05 | +2.80 pp |
| August 2022 | 90.25 | −4.40 pp |
| July 2022 | 94.65 | +0.72 pp |
| June 2022 | 93.93 | +2.30 pp |
| May 2022 | 91.63 | +2.53 pp |
| April 2022 | 89.10 | +18.77 pp |
| March 2022 | 70.33 | +5.86 pp |
| February 2022 | 64.47 | +8.86 pp |
| January 2022 | 55.61 | +11.81 pp |
| December 2021 | 43.80 | +16.69 pp |
| November 2021 | 27.11 | −0.30 pp |
| October 2021 | 27.41 | −1.38 pp |
| September 2021 | 28.79 | −0.21 pp |
| August 2021 | 29.00 | +4.08 pp |
| July 2021 | 24.92 | +4.93 pp |
| June 2021 | 19.99 | +2.95 pp |
| May 2021 | 17.04 | +0.06 pp |
| April 2021 | 16.98 | −0.46 pp |
| March 2021 | 17.44 | −0.96 pp |
| February 2021 | 18.40 | +0.29 pp |
| January 2021 | 18.11 | −2.50 pp |
| December 2020 | 20.61 | −0.47 pp |
| November 2020 | 21.08 | +4.57 pp |
| October 2020 | 16.51 | +1.56 pp |
| September 2020 | 14.95 | +1.44 pp |
| August 2020 | 13.51 | +0.78 pp |
| July 2020 | 12.73 | −0.20 pp |
| June 2020 | 12.93 | +0.06 pp |
| May 2020 | 12.87 | +1.59 pp |
| April 2020 | 11.28 | +1.23 pp |
| March 2020 | 10.05 | −0.53 pp |
| February 2020 | 10.58 | +1.54 pp |
| January 2020 | 9.04 | −1.85 pp |
| December 2019 | 10.89 | +2.00 pp |
| November 2019 | 8.89 | +1.04 pp |
| October 2019 | 7.85 | −1.67 pp |
| September 2019 | 9.52 | −7.70 pp |
| August 2019 | 17.22 | −0.99 pp |
| July 2019 | 18.21 | −0.99 pp |
| June 2019 | 19.20 | −9.24 pp |
| May 2019 | 28.44 | −3.42 pp |
| April 2019 | 31.86 | +2.09 pp |
| March 2019 | 29.77 | +0.52 pp |
| February 2019 | 29.25 | −1.72 pp |
| January 2019 | 30.97 | +5.86 pp |
| December 2018 | 25.11 | −0.55 pp |
| November 2018 | 25.66 | −3.60 pp |
| October 2018 | 29.26 | +1.56 pp |
| September 2018 | 27.70 | +7.95 pp |
| August 2018 | 19.75 | +0.35 pp |
| July 2018 | 19.40 | +0.51 pp |
| June 2018 | 18.89 | +7.89 pp |
| May 2018 | 11.00 | +2.19 pp |
| April 2018 | 8.81 | −1.56 pp |
| March 2018 | 10.37 | +0.10 pp |
| February 2018 | 10.27 | +1.51 pp |
| January 2018 | 8.76 | −5.03 pp |
| December 2017 | 13.79 | −1.99 pp |
| November 2017 | 15.78 | +3.04 pp |
| October 2017 | 12.74 | +0.24 pp |
| September 2017 | 12.50 | +0.53 pp |
| August 2017 | 11.97 | +1.90 pp |
| July 2017 | 10.07 | −4.27 pp |
| June 2017 | 14.34 | −2.57 pp |
| May 2017 | 16.91 | +1.28 pp |
| April 2017 | 15.63 | +3.10 pp |
| March 2017 | 12.53 | +3.81 pp |
| February 2017 | 8.72 | +0.95 pp |
| January 2017 | 7.77 | +2.12 pp |
| December 2016 | 5.65 | +2.10 pp |
| November 2016 | 3.55 | −1.65 pp |
| October 2016 | 5.20 | +1.04 pp |
| September 2016 | 4.16 | −2.03 pp |
| August 2016 | 6.19 | −3.50 pp |
| July 2016 | 9.69 | +3.06 pp |
| June 2016 | 6.63 | +4.16 pp |
| May 2016 | 2.47 | +1.09 pp |
| April 2016 | 1.38 | −3.20 pp |
| March 2016 | 4.58 | −4.25 pp |
| February 2016 | 8.83 | −2.86 pp |
| January 2016 | 11.69 | +0.82 pp |
| December 2015 | 10.87 | +1.36 pp |
| November 2015 | 9.51 | +0.82 pp |
| October 2015 | 8.69 | −2.04 pp |
| September 2015 | 10.73 | +1.02 pp |
| August 2015 | 9.71 | +0.46 pp |
| July 2015 | 9.25 | −0.03 pp |
| June 2015 | 9.28 | −3.53 pp |
| May 2015 | 12.81 | −1.55 pp |
| April 2015 | 14.36 | +0.24 pp |
| March 2015 | 14.12 | +0.42 pp |
| February 2015 | 13.70 | +2.73 pp |
| January 2015 | 10.97 | −1.76 pp |
| December 2014 | 12.73 | −1.64 pp |
| November 2014 | 14.37 | +1.81 pp |
| October 2014 | 12.56 | −1.39 pp |
| September 2014 | 13.95 | −0.49 pp |
| August 2014 | 14.44 | +1.88 pp |
| July 2014 | 12.56 | +0.09 pp |
| June 2014 | 12.47 | −1.64 pp |
| May 2014 | 14.11 | +0.96 pp |
| April 2014 | 13.15 | +3.03 pp |
| March 2014 | 10.12 | +0.07 pp |
| February 2014 | 10.05 | −0.84 pp |
| January 2014 | 10.89 | +1.22 pp |
| December 2013 | 9.67 | −0.10 pp |
| November 2013 | 9.77 | −1.36 pp |
| October 2013 | 11.13 | +2.40 pp |
| September 2013 | 8.73 | −1.52 pp |
| August 2013 | 10.25 | −2.47 pp |
| July 2013 | 12.72 | −0.16 pp |
| June 2013 | 12.88 | +5.81 pp |
| May 2013 | 7.07 | +0.24 pp |
| April 2013 | 6.83 | −1.27 pp |
| March 2013 | 8.10 | +2.50 pp |
| February 2013 | 5.60 | −1.25 pp |
| January 2013 | 6.85 | +2.95 pp |
| December 2012 | 3.90 | −0.42 pp |
| November 2012 | 4.32 | −3.55 pp |
| October 2012 | 7.87 | −2.52 pp |
| September 2012 | 10.39 | +1.25 pp |
| August 2012 | 9.14 | +0.08 pp |
| July 2012 | 9.06 | +1.68 pp |
| June 2012 | 7.38 | +3.31 pp |
| May 2012 | 4.07 | −7.58 pp |
| April 2012 | 11.65 | +0.40 pp |
| March 2012 | 11.25 | +0.08 pp |
| February 2012 | 11.17 | −0.50 pp |
| January 2012 | 11.67 | −0.54 pp |
| December 2011 | 12.21 | +5.10 pp |
| November 2011 | 7.11 | +5.35 pp |
| October 2011 | 1.76 | −0.47 pp |
| September 2011 | 2.23 | −3.77 pp |
| August 2011 | 6.00 | −1.65 pp |
| July 2011 | 7.65 | −0.48 pp |
| June 2011 | 8.13 | −4.48 pp |
| May 2011 | 12.61 | +9.78 pp |
| April 2011 | 2.83 | −0.64 pp |
| March 2011 | 3.47 | −1.06 pp |
| February 2011 | 4.53 | −2.53 pp |
| January 2011 | 7.06 | +0.04 pp |
| December 2010 | 7.02 | −5.37 pp |
| November 2010 | 12.39 | −4.69 pp |
| October 2010 | 17.08 | +1.75 pp |
| September 2010 | 15.33 | +4.96 pp |
| August 2010 | 10.37 | +4.85 pp |
| July 2010 | 5.52 | −0.10 pp |
| June 2010 | 5.62 | −1.04 pp |
| May 2010 | 6.66 | −5.10 pp |
| April 2010 | 11.76 | +0.55 pp |
| March 2010 | 11.21 | −3.63 pp |
| February 2010 | 14.84 | +5.46 pp |
| January 2010 | 9.38 | +0.12 pp |
| December 2009 | 9.26 | +1.86 pp |
| November 2009 | 7.40 | +1.58 pp |
| October 2009 | 5.82 | −0.97 pp |
| September 2009 | 6.79 | −0.04 pp |
| August 2009 | 6.83 | −1.68 pp |
| July 2009 | 8.51 | −1.17 pp |
| June 2009 | 9.68 | +2.05 pp |
| May 2009 | 7.63 | −0.07 pp |
| April 2009 | 7.70 | −1.48 pp |
| March 2009 | 9.18 | +3.02 pp |
| February 2009 | 6.16 | −5.35 pp |
| January 2009 | 11.51 | −0.39 pp |
| December 2008 | 11.90 | +0.13 pp |
| November 2008 | 11.77 | +0.17 pp |
| October 2008 | 11.60 | +0.53 pp |
| September 2008 | 11.07 | −2.26 pp |
| August 2008 | 13.33 | −1.95 pp |
| July 2008 | 15.28 | +1.32 pp |
| June 2008 | 13.96 | −1.73 pp |
| May 2008 | 15.69 | +2.21 pp |
| April 2008 | 13.48 | +0.08 pp |
| March 2008 | 13.40 | +0.47 pp |
| February 2008 | 12.93 | +3.71 pp |
| January 2008 | 9.22 | −2.81 pp |
| December 2007 | 12.03 | −0.26 pp |
| November 2007 | 12.29 | −2.42 pp |
| October 2007 | 14.71 | +2.95 pp |
| September 2007 | 11.76 | −0.63 pp |
| August 2007 | 12.39 | +3.20 pp |
| July 2007 | 9.19 | −2.33 pp |
| June 2007 | 11.52 | +0.88 pp |
| May 2007 | 10.64 | −2.67 pp |
| April 2007 | 13.31 | +0.37 pp |
| March 2007 | 12.94 | −0.76 pp |
| February 2007 | 13.70 | −0.90 pp |
| January 2007 | 14.60 | +3.43 pp |
| December 2006 | 11.17 | +0.95 pp |
| November 2006 | 10.22 | −0.59 pp |
| October 2006 | 10.81 | −1.64 pp |
| September 2006 | 12.45 | +1.67 pp |
| August 2006 | 10.78 | −1.27 pp |
| July 2006 | 12.05 | +2.83 pp |
| June 2006 | 9.22 | −1.21 pp |
| May 2006 | 10.43 | +0.77 pp |
| April 2006 | 9.66 | +1.72 pp |
| March 2006 | 7.94 | +1.28 pp |
| February 2006 | 6.66 | +1.60 pp |
| January 2006 | 5.06 | +0.14 pp |
| December 2005 | 4.92 | −0.78 pp |
| November 2005 | 5.70 | +1.95 pp |
| October 2005 | 3.75 | −0.63 pp |
| September 2005 | 4.38 | +0.86 pp |
| August 2005 | 3.52 | −0.91 pp |
| July 2005 | 4.43 | −1.52 pp |
| June 2005 | 5.95 | +0.94 pp |
| May 2005 | 5.01 | +1.49 pp |
| April 2005 | 3.52 | −1.31 pp |
| March 2005 | 4.83 | −1.54 pp |
| February 2005 | 6.37 | −0.42 pp |
| January 2005 | 6.79 |
Related indicators
Prices and inflationAnnual consumer price inflation (CPI)
29.77%
October 2026 +0.04 pp
Monthly inflation (CPI, monthly change)
2.58%
October 2026 +0.74 pp
Domestic Producer Price Index (D-PPI, annual change)
27.41%
October 2026 +0.03 pp
Construction cost index (annual change)
30.80%
September 2026 +1.21 pp
Core inflation (special CPI aggregate C, annual)
28.28%
October 2026 −0.42 pp
Rent inflation (CPI rent, annual)
39.71%
October 2026 −1.63 pp
What does this indicator measure?
Food inflation is the annual price change in the food and non-alcoholic beverages main expenditure group of the Consumer Price Index (CPI). The rate on this page is the percent change in the group's index compared with the same month of the previous year.
The series is taken from the table of special CPI aggregates that TurkStat publishes with the CPI bulletin and starts in 2005. According to TurkStat's note, a new series with base 2025=100 is used from 2026, and all past calculations were redone with the COICOP 2018 classification.
The chart also shows the unprocessed (e.g. fresh fruit and vegetables) and processed (e.g. bread and cereals) food subgroups and headline CPI.
How to read it
- The rate shows how much food and non-alcoholic beverage prices rose on average over the last 12 months.
- Unprocessed food, especially fresh fruit and vegetables, moves more with the seasons than processed food.
Common misreadings
- Food inflation is not the price increase of a single product; it is the weighted average of all products in the group.
- Meals eaten in restaurants and cafes are not in this group but in restaurants and accommodation services.
- A fall in food inflation does not mean food prices fell; as long as the rate is above zero, prices keep rising.
Frequently asked questions
What is the food inflation rate in Turkey?
According to TurkStat, the annual change in the food and non-alcoholic beverages group of the CPI was 27.73% in October 2026. In the previous month (September 2026) it was 27.62%.
When is food inflation released?
Food inflation is part of the monthly CPI bulletin. According to TurkStat's release calendar, the next release is on: Thursday 3 December 2026, 10:00.
Which products are included in food inflation?
The CPI food and non-alcoholic beverages group covers food such as bread and cereals, meat, dairy products, fruit and vegetables, and non-alcoholic beverages such as water, fruit juice, tea and coffee.
What is the difference between unprocessed and processed food?
In TurkStat's special aggregates, unprocessed food covers fresh fruit and vegetables and other unprocessed food; processed food covers bread and cereals and other processed food. The chart on this page shows both groups.
Why is food inflation different from headline inflation?
Headline inflation covers the whole basket of goods and services, food inflation only the food and non-alcoholic beverages group; the two rates can therefore differ in the same month.
By month
- October 2026
- September 2026
- August 2026
- July 2026
- June 2026
- May 2026
- April 2026
- March 2026
- February 2026
- January 2026
- December 2025
- November 2025
- October 2025
- September 2025
- August 2025
- July 2025
- June 2025
- May 2025
- April 2025
- March 2025
- February 2025
- January 2025
- December 2024
- November 2024
- October 2024
- September 2024
- August 2024
- July 2024
- June 2024
- May 2024
- April 2024
- March 2024
- February 2024
- January 2024
- December 2023
- November 2023