Turkey Gini coefficient
Gini coefficient (income distribution) · Turkish Statistical Institute
Short answer
0.410
2025 −0.003 pp
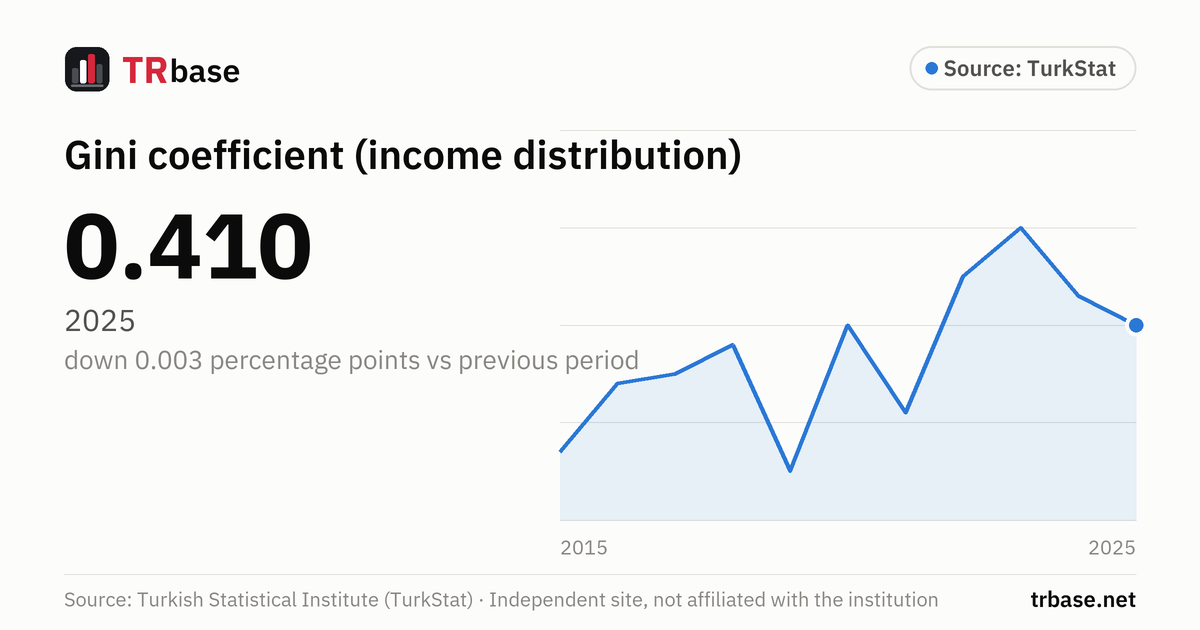
According to the results of TurkStat's 2025 Income and Living Conditions Survey, Türkiye's Gini coefficient was 0.410. That is down 0.003 percentage points from the previous year.
- Gini coefficient has fallen for two consecutive years.
Next release: Tuesday 22 December 2026, 10:00
Gini coefficient (income distribution), 2006 – 2025
Unit: coefficient (0-1). Source: Turkish Statistical Institute (TurkStat). Hover over the chart, or focus it and use the arrow keys.
Data table
All values in the chart, newest first. Unit: coefficient (0-1).
| Period | Gini coefficient (coefficient (0-1)) | Change vs previous period |
|---|---|---|
| 2025 | 0.410 | −0.003 pp |
| 2024 | 0.413 | −0.007 pp |
| 2023 | 0.420 | +0.005 pp |
| 2022 | 0.415 | +0.014 pp |
| 2021 | 0.401 | −0.009 pp |
| 2020 | 0.410 | +0.015 pp |
| 2019 | 0.395 | −0.013 pp |
| 2018 | 0.408 | +0.003 pp |
| 2017 | 0.405 | +0.001 pp |
| 2016 | 0.404 | +0.007 pp |
| 2015 | 0.397 | +0.006 pp |
| 2014 | 0.391 | −0.009 pp |
| 2013 | 0.400 | −0.002 pp |
| 2012 | 0.402 | −0.002 pp |
| 2011 | 0.404 | +0.002 pp |
| 2010 | 0.402 | −0.013 pp |
| 2009 | 0.415 | +0.010 pp |
| 2008 | 0.405 | −0.001 pp |
| 2007 | 0.406 | −0.022 pp |
| 2006 | 0.428 |
Related indicators
Growth and incomeGDP growth rate (annual change, quarterly)
2.3%
2026 Q2 −0.3 pp
GDP per capita (US dollars)
18,103 USD
2025 +17.89%
Relative poverty rate (50% of median income)
13.0%
2025 −0.6 pp
Growth expectation (Market Participants Survey, current year GDP growth)
2.88%
November 2026 −0.04 pp
Annual consumer price inflation (CPI)
29.77%
October 2026 +0.04 pp
Monthly inflation (CPI, monthly change)
2.58%
October 2026 +0.74 pp
What does this indicator measure?
The Gini coefficient measures inequality in the income distribution. By TurkStat's definition, a coefficient closer to zero indicates equality in the income distribution, and a coefficient closer to one indicates greater inequality.
TurkStat uses equivalized household disposable income in the calculation: taxes paid and regular transfers made to other households are deducted from the household's annual income, and the result is converted into equivalent income per person according to the size and composition of the household.
The years on the chart are survey years. Income data refer to the previous calendar year; for example, incomes in the 2025 survey belong to 2024. The series starts in 2006.
How to read it
- Year-to-year changes are mostly below 0.01; small moves should be read together with several years.
- In the same bulletin TurkStat also publishes the income shares of the highest and lowest 20% income groups and the P80/P20 ratio.
Common misreadings
- The Gini coefficient does not measure income level or poverty; it shows only how equally income is distributed across the population.
- The year shown is the year the survey was conducted, not the year the income was earned.
- The coefficient measures the distribution of income, not of wealth (property, savings).
Frequently asked questions
What is Turkey's Gini coefficient?
According to the results of TurkStat's 2025 survey, the Gini coefficient was 0.410. In the previous survey (2024) it was 0.413.
What does the Gini coefficient show?
It shows inequality in the income distribution. The closer it is to zero, the more equally income is distributed; the closer to one, the more unequally.
Which year's income does it refer to?
It refers to the calendar year before the survey year. For example, the 2025 survey covers 2024 incomes.
When is the Gini coefficient announced?
TurkStat announces the Gini coefficient once a year with the Income Distribution Statistics bulletin. The next release in the calendar: Tuesday 22 December 2026, 10:00.