Turkey GDP growth expectations
Growth expectation (Market Participants Survey, current year GDP growth) · Central Bank of the Republic of Türkiye
Short answer
2.88%
November 2026 −0.04 pp
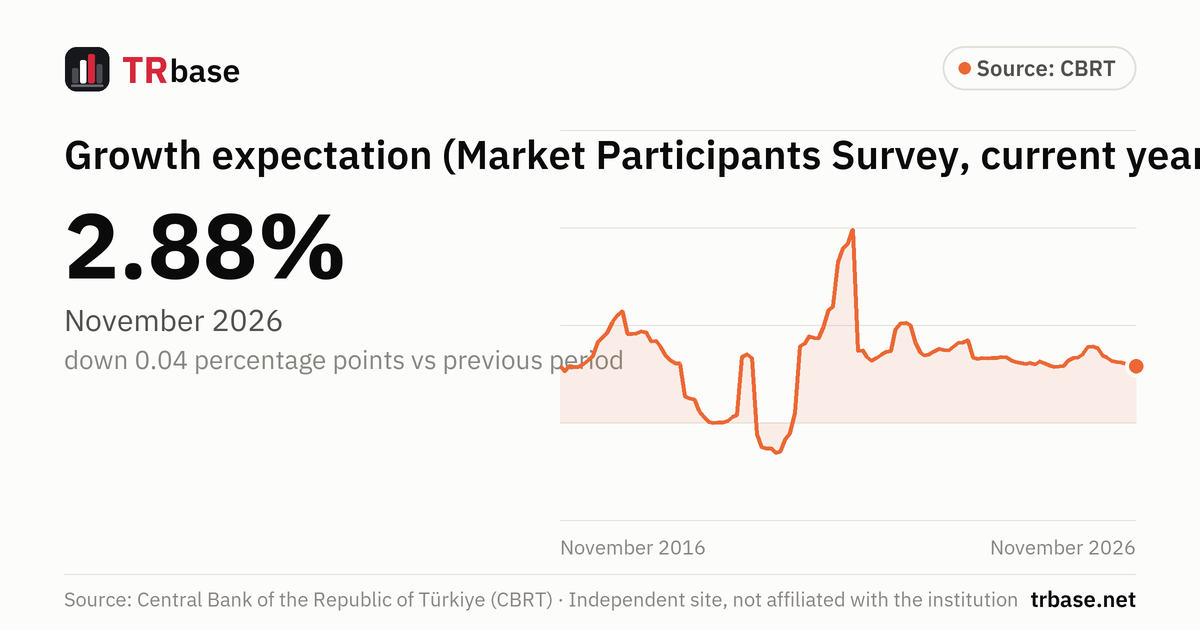
According to the CBRT's November 2026 Market Participants Survey, participants' expectation for GDP growth in the current year is 2.88%. That is down 0.04 percentage points from the previous month.
- Growth expectation has fallen for nine consecutive months.
- A year earlier (November 2025) it was 3.35%; the latest value is 0.47 percentage points lower.
Growth expectation (Market Participants Survey, current year GDP growth), January 2013 – November 2026
Unit: %. Source: Central Bank of the Republic of Türkiye (CBRT). Hover over the chart, or focus it and use the arrow keys.
Data table
All values in the chart, newest first. Unit: %.
| Period | Growth expectation (%) | Change vs previous period |
|---|---|---|
| November 2026 | 2.88 | −0.04 pp |
| October 2026 | 2.92 | −0.10 pp |
| September 2026 | 3.02 | −0.08 pp |
| August 2026 | 3.10 | −0.02 pp |
| July 2026 | 3.12 | −0.05 pp |
| June 2026 | 3.17 | −0.17 pp |
| May 2026 | 3.34 | −0.11 pp |
| April 2026 | 3.45 | −0.39 pp |
| March 2026 | 3.84 | −0.06 pp |
| February 2026 | 3.90 | +0.02 pp |
| January 2026 | 3.88 | +0.35 pp |
| December 2025 | 3.53 | +0.18 pp |
| November 2025 | 3.35 | +0.03 pp |
| October 2025 | 3.32 | +0.13 pp |
| September 2025 | 3.19 | +0.29 pp |
| August 2025 | 2.90 | +0.01 pp |
| July 2025 | 2.89 | +0.02 pp |
| June 2025 | 2.87 | −0.06 pp |
| May 2025 | 2.93 | −0.11 pp |
| April 2025 | 3.04 | −0.10 pp |
| March 2025 | 3.14 | +0.14 pp |
| February 2025 | 3.00 | −0.06 pp |
| January 2025 | 3.06 | +0.04 pp |
| December 2024 | 3.02 | −0.05 pp |
| November 2024 | 3.07 | −0.05 pp |
| October 2024 | 3.12 | −0.07 pp |
| September 2024 | 3.19 | −0.16 pp |
| August 2024 | 3.35 | −0.02 pp |
| July 2024 | 3.37 | +0.04 pp |
| June 2024 | 3.33 | +0.01 pp |
| May 2024 | 3.32 | +0.03 pp |
| April 2024 | 3.29 | −0.03 pp |
| March 2024 | 3.32 | +0.04 pp |
| February 2024 | 3.28 | −0.07 pp |
| January 2024 | 3.35 | −0.87 pp |
| December 2023 | 4.22 | +0.10 pp |
| November 2023 | 4.12 | +0.02 pp |
| October 2023 | 4.10 | +0.18 pp |
| September 2023 | 3.92 | +0.22 pp |
| August 2023 | 3.70 | −0.03 pp |
| July 2023 | 3.73 | −0.05 pp |
| June 2023 | 3.78 | +0.12 pp |
| May 2023 | 3.66 | +0.15 pp |
| April 2023 | 3.51 | +0.06 pp |
| March 2023 | 3.45 | −0.16 pp |
| February 2023 | 3.61 | −0.49 pp |
| January 2023 | 4.10 | −0.90 pp |
| December 2022 | 5.00 | −0.12 pp |
| November 2022 | 5.12 | +0.04 pp |
| October 2022 | 5.08 | +0.31 pp |
| September 2022 | 4.77 | +1.08 pp |
| August 2022 | 3.69 | +0.06 pp |
| July 2022 | 3.63 | +0.16 pp |
| June 2022 | 3.47 | +0.14 pp |
| May 2022 | 3.33 | +0.16 pp |
| April 2022 | 3.17 | −0.21 pp |
| March 2022 | 3.38 | −0.33 pp |
| February 2022 | 3.71 | +0.02 pp |
| January 2022 | 3.69 | −6.19 pp |
| December 2021 | 9.88 | +0.69 pp |
| November 2021 | 9.19 | +0.26 pp |
| October 2021 | 8.93 | +0.70 pp |
| September 2021 | 8.23 | +2.27 pp |
| August 2021 | 5.96 | +0.21 pp |
| July 2021 | 5.75 | +0.85 pp |
| June 2021 | 4.90 | +0.58 pp |
| May 2021 | 4.32 | −0.02 pp |
| April 2021 | 4.34 | −0.08 pp |
| March 2021 | 4.42 | +0.37 pp |
| February 2021 | 4.05 | +0.14 pp |
| January 2021 | 3.91 | +3.42 pp |
| December 2020 | 0.49 | +1.04 pp |
| November 2020 | −0.55 | +0.28 pp |
| October 2020 | −0.83 | +0.65 pp |
| September 2020 | −1.48 | +0.08 pp |
| August 2020 | −1.56 | −0.24 pp |
| July 2020 | −1.32 | +0.01 pp |
| June 2020 | −1.33 | −0.08 pp |
| May 2020 | −1.25 | −0.65 pp |
| April 2020 | −0.60 | −3.93 pp |
| March 2020 | 3.33 | −0.17 pp |
| February 2020 | 3.50 | +0.14 pp |
| January 2020 | 3.36 | +2.95 pp |
| December 2019 | 0.41 | +0.12 pp |
| November 2019 | 0.29 | +0.20 pp |
| October 2019 | 0.09 | +0.08 pp |
| September 2019 | 0.01 | −0.01 pp |
| August 2019 | 0.02 | +0.04 pp |
| July 2019 | −0.02 | −0.06 pp |
| June 2019 | 0.04 | −0.25 pp |
| May 2019 | 0.29 | −0.30 pp |
| April 2019 | 0.59 | −0.61 pp |
| March 2019 | 1.20 | −0.04 pp |
| February 2019 | 1.24 | −0.11 pp |
| January 2019 | 1.35 | −1.69 pp |
| December 2018 | 3.04 | −0.01 pp |
| November 2018 | 3.05 | −0.15 pp |
| October 2018 | 3.20 | −0.23 pp |
| September 2018 | 3.43 | −0.43 pp |
| August 2018 | 3.86 | −0.33 pp |
| July 2018 | 4.19 | +0.02 pp |
| June 2018 | 4.17 | −0.47 pp |
| May 2018 | 4.64 | −0.04 pp |
| April 2018 | 4.68 | +0.10 pp |
| March 2018 | 4.58 | +0.02 pp |
| February 2018 | 4.56 | +0.01 pp |
| January 2018 | 4.55 | −1.16 pp |
| December 2017 | 5.71 | +0.20 pp |
| November 2017 | 5.51 | +0.35 pp |
| October 2017 | 5.16 | +0.52 pp |
| September 2017 | 4.64 | +0.24 pp |
| August 2017 | 4.40 | +0.27 pp |
| July 2017 | 4.13 | +0.70 pp |
| June 2017 | 3.43 | +0.21 pp |
| May 2017 | 3.22 | +0.21 pp |
| April 2017 | 3.01 | +0.15 pp |
| March 2017 | 2.86 | −0.01 pp |
| February 2017 | 2.87 | −0.03 pp |
| January 2017 | 2.90 | +0.28 pp |
| December 2016 | 2.62 | −0.28 pp |
| November 2016 | 2.90 | −0.30 pp |
| October 2016 | 3.20 | −0.20 pp |
| September 2016 | 3.40 | −0.07 pp |
| August 2016 | 3.47 | −0.20 pp |
| July 2016 | 3.67 | 0.00 pp |
| June 2016 | 3.67 | +0.07 pp |
| May 2016 | 3.60 | −0.02 pp |
| April 2016 | 3.62 | +0.03 pp |
| March 2016 | 3.59 | +0.02 pp |
| February 2016 | 3.57 | +0.14 pp |
| January 2016 | 3.43 | +0.21 pp |
| December 2015 | 3.22 | +0.27 pp |
| November 2015 | 2.95 | +0.02 pp |
| October 2015 | 2.93 | +0.05 pp |
| September 2015 | 2.88 | 0.00 pp |
| August 2015 | 2.88 | −0.12 pp |
| July 2015 | 3.00 | −0.07 pp |
| June 2015 | 3.07 | 0.00 pp |
| May 2015 | 3.07 | −0.04 pp |
| April 2015 | 3.11 | −0.22 pp |
| March 2015 | 3.33 | −0.13 pp |
| February 2015 | 3.46 | +0.02 pp |
| January 2015 | 3.44 | +0.40 pp |
| December 2014 | 3.04 | −0.15 pp |
| November 2014 | 3.19 | +0.04 pp |
| October 2014 | 3.15 | −0.06 pp |
| September 2014 | 3.21 | −0.10 pp |
| August 2014 | 3.31 | −0.04 pp |
| July 2014 | 3.35 | +0.01 pp |
| June 2014 | 3.34 | +0.51 pp |
| May 2014 | 2.83 | +0.10 pp |
| April 2014 | 2.73 | +0.11 pp |
| March 2014 | 2.62 | −0.13 pp |
| February 2014 | 2.75 | −0.48 pp |
| January 2014 | 3.23 | −0.48 pp |
| December 2013 | 3.71 | +0.16 pp |
| November 2013 | 3.55 | +0.01 pp |
| October 2013 | 3.54 | 0.00 pp |
| September 2013 | 3.54 | +0.05 pp |
| August 2013 | 3.49 | −0.08 pp |
| July 2013 | 3.57 | −0.32 pp |
| June 2013 | 3.89 | −0.16 pp |
| May 2013 | 4.05 | −0.15 pp |
| April 2013 | 4.20 | −0.03 pp |
| March 2013 | 4.23 | +0.01 pp |
| February 2013 | 4.22 | +0.02 pp |
| January 2013 | 4.20 |
Current and next year (%)
| Period | Growth expectation | Next year |
|---|---|---|
| November 2026 | 2.88 | 3.85 |
| October 2026 | 2.92 | 3.88 |
| September 2026 | 3.02 | 3.94 |
| August 2026 | 3.10 | 4.00 |
| July 2026 | 3.12 | 4.06 |
| June 2026 | 3.17 | 4.10 |
| May 2026 | 3.34 | 4.07 |
| April 2026 | 3.45 | 4.12 |
| March 2026 | 3.84 | 4.31 |
| February 2026 | 3.90 | 4.29 |
| January 2026 | 3.88 | 4.29 |
| December 2025 | 3.53 | 3.85 |
| November 2025 | 3.35 | 3.77 |
| October 2025 | 3.32 | 3.76 |
| September 2025 | 3.19 | 3.74 |
| August 2025 | 2.90 | 3.69 |
| July 2025 | 2.89 | 3.71 |
| June 2025 | 2.87 | 3.70 |
| May 2025 | 2.93 | 3.73 |
| April 2025 | 3.04 | 3.80 |
| March 2025 | 3.14 | 3.95 |
| February 2025 | 3.00 | 3.86 |
| January 2025 | 3.06 | 3.92 |
| December 2024 | 3.02 | 3.13 |
| November 2024 | 3.07 | 3.22 |
| October 2024 | 3.12 | 3.30 |
| September 2024 | 3.19 | 3.36 |
| August 2024 | 3.35 | 3.51 |
| July 2024 | 3.37 | 3.61 |
| June 2024 | 3.33 | 3.66 |
| May 2024 | 3.32 | 3.67 |
| April 2024 | 3.29 | 3.71 |
| March 2024 | 3.32 | 3.78 |
| February 2024 | 3.28 | 3.83 |
| January 2024 | 3.35 | 3.85 |
| December 2023 | 4.22 | 3.29 |
| November 2023 | 4.12 | 3.33 |
| October 2023 | 4.10 | 3.42 |
| September 2023 | 3.92 | 3.80 |
| August 2023 | 3.70 | 4.04 |
| July 2023 | 3.73 | 4.31 |
| June 2023 | 3.78 | 4.49 |
| May 2023 | 3.66 | 4.60 |
| April 2023 | 3.51 | 4.43 |
| March 2023 | 3.45 | 4.38 |
| February 2023 | 3.61 | 4.48 |
| January 2023 | 4.10 | 4.33 |
| December 2022 | 5.00 | 4.06 |
| November 2022 | 5.12 | 4.12 |
| October 2022 | 5.08 | 4.23 |
| September 2022 | 4.77 | 4.46 |
| August 2022 | 3.69 | 3.81 |
| July 2022 | 3.63 | 3.80 |
| June 2022 | 3.47 | 3.80 |
| May 2022 | 3.33 | 3.96 |
| April 2022 | 3.17 | 4.00 |
| March 2022 | 3.38 | 4.16 |
| February 2022 | 3.71 | 4.21 |
| January 2022 | 3.69 | 4.23 |
| December 2021 | 9.88 | 4.05 |
| November 2021 | 9.19 | 4.15 |
| October 2021 | 8.93 | 4.15 |
| September 2021 | 8.23 | 4.20 |
| August 2021 | 5.96 | 4.01 |
| July 2021 | 5.75 | 3.98 |
| June 2021 | 4.90 | 4.03 |
| May 2021 | 4.32 | 4.09 |
| April 2021 | 4.34 | 4.19 |
| March 2021 | 4.42 | 4.24 |
| February 2021 | 4.05 | 4.26 |
| January 2021 | 3.91 | 4.27 |
| December 2020 | 0.49 | 3.82 |
| November 2020 | −0.55 | 3.99 |
| October 2020 | −0.83 | 4.12 |
| September 2020 | −1.48 | 4.17 |
| August 2020 | −1.56 | 4.33 |
| July 2020 | −1.32 | 4.65 |
| June 2020 | −1.33 | 4.61 |
| May 2020 | −1.25 | 4.61 |
| April 2020 | −0.60 | 4.64 |
| March 2020 | 3.33 | 3.85 |
| February 2020 | 3.50 | 3.78 |
| January 2020 | 3.36 | 3.72 |
| December 2019 | 0.41 | 3.19 |
| November 2019 | 0.29 | 3.06 |
| October 2019 | 0.09 | 2.96 |
| September 2019 | 0.01 | 2.60 |
| August 2019 | 0.02 | 2.64 |
| July 2019 | −0.02 | 2.62 |
| June 2019 | 0.04 | 2.73 |
| May 2019 | 0.29 | 2.81 |
| April 2019 | 0.59 | 2.91 |
| March 2019 | 1.20 | 3.17 |
| February 2019 | 1.24 | 3.13 |
| January 2019 | 1.35 | 3.03 |
| December 2018 | 3.04 | 1.53 |
| November 2018 | 3.05 | 1.59 |
| October 2018 | 3.20 | 1.89 |
| September 2018 | 3.43 | 2.71 |
| August 2018 | 3.86 | 3.50 |
| July 2018 | 4.19 | 3.97 |
| June 2018 | 4.17 | 4.07 |
| May 2018 | 4.64 | 4.36 |
| April 2018 | 4.68 | 4.48 |
| March 2018 | 4.58 | 4.50 |
| February 2018 | 4.56 | 4.46 |
| January 2018 | 4.55 | 4.48 |
| December 2017 | 5.71 | 4.23 |
| November 2017 | 5.51 | 4.22 |
| October 2017 | 5.16 | 4.29 |
| September 2017 | 4.64 | 4.04 |
| August 2017 | 4.40 | 4.03 |
| July 2017 | 4.13 | 3.94 |
| June 2017 | 3.43 | 3.70 |
| May 2017 | 3.22 | 3.72 |
| April 2017 | 3.01 | 3.66 |
| March 2017 | 2.86 | 3.46 |
| February 2017 | 2.87 | 3.49 |
| January 2017 | 2.90 | 3.59 |
| December 2016 | 2.62 | 3.18 |
| November 2016 | 2.90 | 3.30 |
| October 2016 | 3.20 | 3.59 |
| September 2016 | 3.40 | 3.72 |
| August 2016 | 3.47 | 3.78 |
| July 2016 | 3.67 | 3.87 |
| June 2016 | 3.67 | 3.88 |
| May 2016 | 3.60 | 3.89 |
| April 2016 | 3.62 | 3.88 |
| March 2016 | 3.59 | 3.88 |
| February 2016 | 3.57 | 3.90 |
| January 2016 | 3.43 | 3.78 |
| December 2015 | 3.22 | 3.36 |
| November 2015 | 2.95 | 3.30 |
| October 2015 | 2.93 | 3.16 |
| September 2015 | 2.88 | 3.15 |
| August 2015 | 2.88 | 3.41 |
| July 2015 | 3.00 | 3.46 |
| June 2015 | 3.07 | 3.51 |
| May 2015 | 3.07 | 3.61 |
| April 2015 | 3.11 | 3.63 |
| March 2015 | 3.33 | 3.75 |
| February 2015 | 3.46 | 3.83 |
| January 2015 | 3.44 | 3.78 |
| December 2014 | 3.04 | 3.48 |
| November 2014 | 3.19 | 3.53 |
| October 2014 | 3.15 | 3.60 |
| September 2014 | 3.21 | 3.65 |
| August 2014 | 3.31 | 3.78 |
| July 2014 | 3.35 | 3.87 |
| June 2014 | 3.34 | 3.86 |
| May 2014 | 2.83 | 3.74 |
| April 2014 | 2.73 | 3.72 |
| March 2014 | 2.62 | 3.69 |
| February 2014 | 2.75 | 3.79 |
| January 2014 | 3.23 | 3.93 |
| December 2013 | 3.71 | 3.88 |
| November 2013 | 3.55 | 3.83 |
| October 2013 | 3.54 | 3.93 |
| September 2013 | 3.54 | 3.98 |
| August 2013 | 3.49 | 4.19 |
| July 2013 | 3.57 | 4.27 |
| June 2013 | 3.89 | 4.52 |
| May 2013 | 4.05 | 4.67 |
| April 2013 | 4.20 | 4.77 |
| March 2013 | 4.23 | 4.69 |
| February 2013 | 4.22 | 4.76 |
| January 2013 | 4.20 | 4.74 |
Related indicators
Growth and incomeGDP growth rate (annual change, quarterly)
2.3%
2026 Q2 −0.3 pp
GDP per capita (US dollars)
18,103 USD
2025 +17.89%
Gini coefficient (income distribution)
0.410
2025 −0.003 pp
Relative poverty rate (50% of median income)
13.0%
2025 −0.6 pp
US dollar exchange rate (CBRT forex buying)
50.4028 TRY
20 November 2026 +0.05%
Euro exchange rate (CBRT forex buying)
55.2974 TRY
20 November 2026 −0.11%
What does this indicator measure?
The Market Participants Survey is a survey the CBRT conducts every month to monitor the expectations of decision makers and experts in the financial and real sectors on variables such as inflation, the exchange rate, growth and interest rates.
The value on this page is participants' expectation for gross domestic product (GDP) growth in the survey year. Values are the appropriate average of participants' responses. Looking at the distribution of responses, the CBRT chooses the appropriate average from among the arithmetic mean, the median, the mode or averages calculated after excluding outliers.
The year the expectation refers to changes every January. The series starts in January 2013. The growth expectation for the next year is also shown in the chart.
How to read it
- The January value does not cover the same year as the previous December; the difference between these two months is not a change in expectations but a change in the target year.
- The change in the table is the difference in percentage points from the previous survey.
- The CBRT gives the growth expectation with one decimal in its monthly report (e.g. 2.9); this page shows the two-decimal value in EVDS (e.g. 2.88).
Common misreadings
- This value is not an outcome but the expectation of survey participants.
- The CBRT's own forecasts (e.g. those in the Inflation Report) are not results of this survey; they are separate publications.
- Actual growth is announced by TurkStat; the value on this page is an annual growth expectation and is not directly comparable with quarterly growth data.
Frequently asked questions
What is the GDP growth expectation for Turkey?
According to the CBRT's November 2026 Market Participants Survey, participants' expectation for GDP growth in the current year is 2.88%. In the previous survey (October 2026) it was 2.92%.
When is the Market Participants Survey released?
The survey is conducted every month. According to the CBRT, responses are collected over three days in the second or third week of the month; results are published on the second business day after data collection ends.
What is the growth expectation for next year?
The CBRT also publishes the next year's GDP growth expectation in the same survey; it is shown in the "Current and next year" view of the chart and in the table.
Where is actual growth?
Actual GDP growth is announced quarterly by TurkStat; on our site it is on the growth rate page.
What is the appropriate average?
It is the statistic that best summarizes the central tendency of the responses. Depending on the shape of the distribution, the CBRT chooses among the arithmetic mean, the median, the mode or averages calculated after excluding outliers.