Turkey poverty rate
Relative poverty rate (50% of median income) · Turkish Statistical Institute
Short answer
13.0%
2025 −0.6 pp
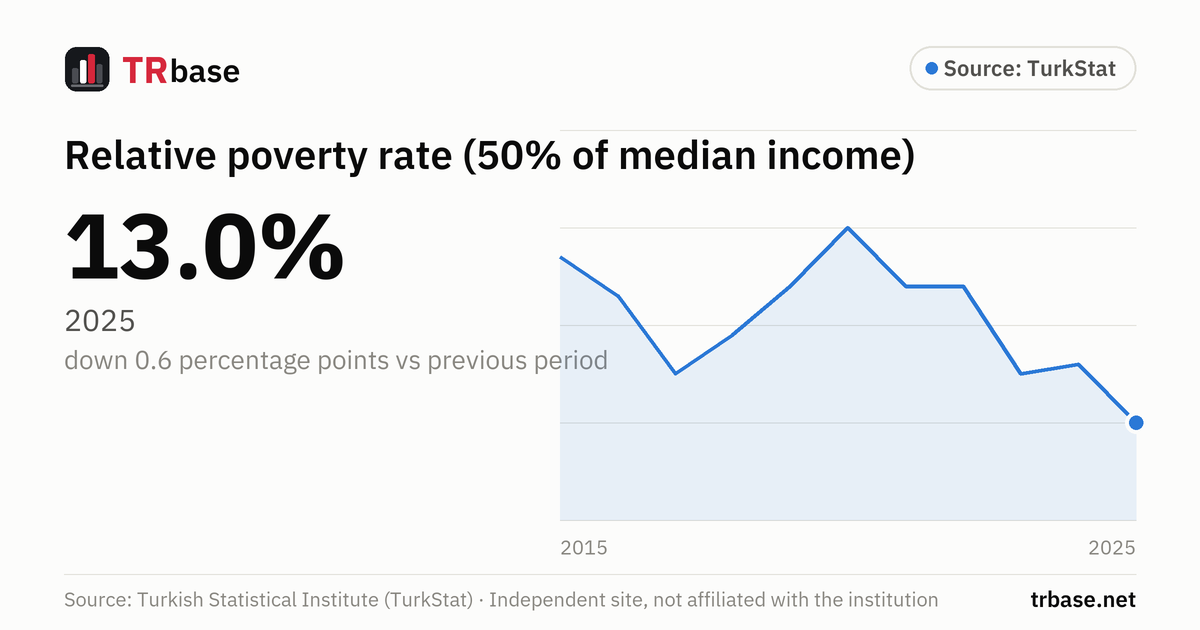
According to TurkStat's 2025 results, the relative poverty rate based on 50% of median income was 13.0%. That is down 0.6 percentage points from the previous year.
- This is the lowest value in the last 10 years.
Next release: Tuesday 29 December 2026, 10:00
Relative poverty rate (50% of median income), 2006 – 2025
Unit: %. Source: Turkish Statistical Institute (TurkStat). Hover over the chart, or focus it and use the arrow keys.
Data table
All values in the chart, newest first. Unit: %.
| Period | Poverty rate (%) | Change vs previous period |
|---|---|---|
| 2025 | 13.0 | −0.6 pp |
| 2024 | 13.6 | +0.1 pp |
| 2023 | 13.5 | −0.9 pp |
| 2022 | 14.4 | 0.0 pp |
| 2021 | 14.4 | −0.6 pp |
| 2020 | 15.0 | +0.6 pp |
| 2019 | 14.4 | +0.5 pp |
| 2018 | 13.9 | +0.4 pp |
| 2017 | 13.5 | −0.8 pp |
| 2016 | 14.3 | −0.4 pp |
| 2015 | 14.7 | −0.3 pp |
| 2014 | 15.0 | 0.0 pp |
| 2013 | 15.0 | −1.3 pp |
| 2012 | 16.3 | +0.2 pp |
| 2011 | 16.1 | −0.8 pp |
| 2010 | 16.9 | −0.2 pp |
| 2009 | 17.1 | +0.4 pp |
| 2008 | 16.7 | +0.4 pp |
| 2007 | 16.3 | −2.3 pp |
| 2006 | 18.6 |
Related indicators
Growth and incomeGDP growth rate (annual change, quarterly)
2.3%
2026 Q2 −0.3 pp
GDP per capita (US dollars)
18,103 USD
2025 +17.89%
Gini coefficient (income distribution)
0.410
2025 −0.003 pp
Growth expectation (Market Participants Survey, current year GDP growth)
2.88%
November 2026 −0.04 pp
Annual consumer price inflation (CPI)
29.77%
October 2026 +0.04 pp
Monthly inflation (CPI, monthly change)
2.58%
October 2026 +0.74 pp
What does this indicator measure?
The rate on this page is TurkStat's relative poverty rate: 50% of median equivalized household disposable income is taken as the poverty line, and the share of the population whose income falls below this line is calculated. This is the line TurkStat uses in its bulletin headline.
In the same survey TurkStat also publishes rates calculated at 40%, 60% and 70% of median income.
The years on the chart are survey years; income data refer to the previous calendar year. The series comes from the Income and Living Conditions Survey from 2006 onward.
How to read it
- Relative poverty measures where a person's income stands compared with the median income of society; the line changes every year along with median income.
- The percentage chosen as the line changes the rate considerably; when comparing figures from different sources, check which line was used.
Common misreadings
- This rate does not measure absolute poverty or hunger; it is a relative, income-based measure.
- The “poverty line” figures that some organizations announce as a monthly lira amount are a different concept and should not be confused with the rate on this page.
- A fall in the rate may not mean that the income of those counted as poor has risen; because the line depends on median income, changes in median income also affect the rate.
Frequently asked questions
What is the poverty rate in Turkey?
According to TurkStat's 2025 results, the relative poverty rate based on 50% of median income was 13.0%. In the previous year (2024) it was 13.6%.
How does TurkStat set the poverty line?
The median of equivalized household disposable incomes is found, and 50% of it is taken as the poverty line. TurkStat also publishes rates based on 40%, 60% and 70% lines.
What does relative poverty mean?
It means people whose income is below a certain line relative to the general income level of society are counted as poor.
Which year's income does it refer to?
It refers to the calendar year before the survey year; for example, the 2025 results are based on 2024 incomes.
When is the poverty rate announced?
TurkStat announces this rate once a year with the Poverty and Living Conditions Statistics bulletin. The next release in the calendar: Tuesday 29 December 2026, 10:00.