Turkey banking sector loan-to-deposit ratio
Loan-to-deposit ratio (banking sector) · Banking Regulation and Supervision Agency
Short answer
91.7%
September 2026 +0.4 pp
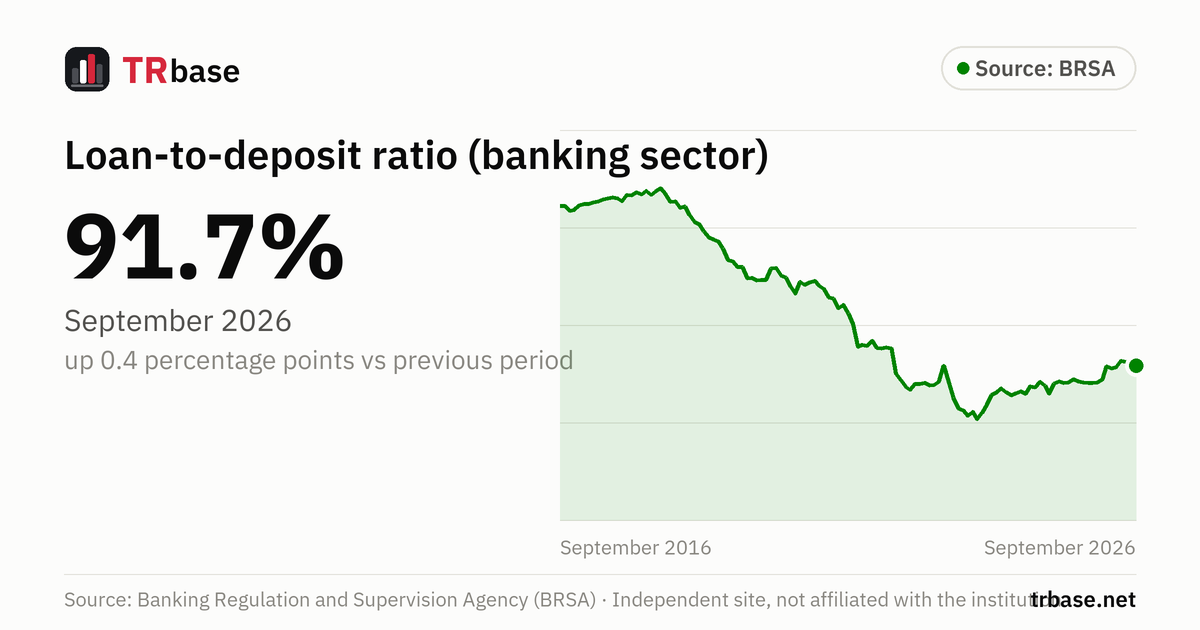
According to BRSA data, the banking sector's loan-to-deposit ratio was 91.7% as of September 2026. That is up 0.4 percentage points from the previous month.
- A year earlier (September 2025) it was 88.5%; the latest value is 3.2 percentage points higher.
Next release: Monday 30 November 2026, 14:00
Loan-to-deposit ratio (banking sector), January 2003 – September 2026
Unit: %. Source: Banking Regulation and Supervision Agency (BRSA). Hover over the chart, or focus it and use the arrow keys.
Data table
All values in the chart, newest first. Unit: %.
| Period | Loan-to-deposit ratio (%) | Change vs previous period |
|---|---|---|
| September 2026 | 91.7 | +0.4 pp |
| August 2026 | 91.3 | −1.2 pp |
| July 2026 | 92.5 | −0.1 pp |
| June 2026 | 92.6 | +1.3 pp |
| May 2026 | 91.4 | +0.3 pp |
| April 2026 | 91.1 | −0.5 pp |
| March 2026 | 91.6 | +2.7 pp |
| February 2026 | 88.9 | +0.7 pp |
| January 2026 | 88.2 | +0.1 pp |
| December 2025 | 88.1 | −0.1 pp |
| November 2025 | 88.2 | 0.0 pp |
| October 2025 | 88.2 | −0.3 pp |
| September 2025 | 88.5 | −0.4 pp |
| August 2025 | 88.9 | +0.6 pp |
| July 2025 | 88.3 | +0.1 pp |
| June 2025 | 88.1 | −0.3 pp |
| May 2025 | 88.5 | +0.4 pp |
| April 2025 | 88.1 | +2.2 pp |
| March 2025 | 85.9 | −1.8 pp |
| February 2025 | 87.6 | −0.8 pp |
| January 2025 | 88.4 | +1.2 pp |
| December 2024 | 87.2 | −0.2 pp |
| November 2024 | 87.4 | +1.5 pp |
| October 2024 | 85.9 | −0.5 pp |
| September 2024 | 86.4 | +0.4 pp |
| August 2024 | 86.0 | +0.4 pp |
| July 2024 | 85.6 | −0.6 pp |
| June 2024 | 86.2 | −0.8 pp |
| May 2024 | 87.1 | +0.9 pp |
| April 2024 | 86.2 | +0.5 pp |
| March 2024 | 85.7 | +1.9 pp |
| February 2024 | 83.8 | +1.8 pp |
| January 2024 | 82.0 | +1.3 pp |
| December 2023 | 80.7 | −1.5 pp |
| November 2023 | 82.2 | +0.8 pp |
| October 2023 | 81.4 | −1.1 pp |
| September 2023 | 82.6 | −0.4 pp |
| August 2023 | 82.9 | −2.1 pp |
| July 2023 | 85.0 | −3.1 pp |
| June 2023 | 88.2 | −3.5 pp |
| May 2023 | 91.6 | +3.2 pp |
| April 2023 | 88.4 | +0.7 pp |
| March 2023 | 87.8 | +0.1 pp |
| February 2023 | 87.6 | −0.5 pp |
| January 2023 | 88.2 | +0.2 pp |
| December 2022 | 87.9 | 0.0 pp |
| November 2022 | 87.9 | +1.2 pp |
| October 2022 | 86.7 | −0.7 pp |
| September 2022 | 87.4 | −1.3 pp |
| August 2022 | 88.7 | −1.3 pp |
| July 2022 | 90.0 | −5.3 pp |
| June 2022 | 95.3 | −0.1 pp |
| May 2022 | 95.4 | +0.1 pp |
| April 2022 | 95.2 | −0.1 pp |
| March 2022 | 95.4 | −1.4 pp |
| February 2022 | 96.8 | +1.0 pp |
| January 2022 | 95.8 | −0.2 pp |
| December 2021 | 95.9 | +0.4 pp |
| November 2021 | 95.6 | −4.8 pp |
| October 2021 | 100.3 | −2.1 pp |
| September 2021 | 102.4 | −1.8 pp |
| August 2021 | 104.2 | +0.8 pp |
| July 2021 | 103.4 | −2.1 pp |
| June 2021 | 105.5 | −0.2 pp |
| May 2021 | 105.7 | −1.7 pp |
| April 2021 | 107.4 | −0.8 pp |
| March 2021 | 108.2 | −0.8 pp |
| February 2021 | 109.0 | +0.3 pp |
| January 2021 | 108.8 | +0.5 pp |
| December 2020 | 108.3 | −0.6 pp |
| November 2020 | 108.9 | +2.5 pp |
| October 2020 | 106.4 | −1.5 pp |
| September 2020 | 107.9 | −1.9 pp |
| August 2020 | 109.8 | −0.4 pp |
| July 2020 | 110.2 | −1.5 pp |
| June 2020 | 111.7 | 0.0 pp |
| May 2020 | 111.7 | +2.4 pp |
| April 2020 | 109.3 | 0.0 pp |
| March 2020 | 109.3 | +0.2 pp |
| February 2020 | 109.1 | −0.6 pp |
| January 2020 | 109.7 | +0.1 pp |
| December 2019 | 109.6 | −2.3 pp |
| November 2019 | 112.0 | 0.0 pp |
| October 2019 | 112.0 | −1.2 pp |
| September 2019 | 113.1 | −0.2 pp |
| August 2019 | 113.3 | −2.4 pp |
| July 2019 | 115.8 | −1.5 pp |
| June 2019 | 117.2 | −0.4 pp |
| May 2019 | 117.6 | −0.4 pp |
| April 2019 | 118.0 | −1.3 pp |
| March 2019 | 119.2 | −1.5 pp |
| February 2019 | 120.7 | −0.5 pp |
| January 2019 | 121.2 | −1.4 pp |
| December 2018 | 122.6 | −1.8 pp |
| November 2018 | 124.4 | +0.3 pp |
| October 2018 | 124.1 | −1.3 pp |
| September 2018 | 125.4 | +0.2 pp |
| August 2018 | 125.2 | −1.7 pp |
| July 2018 | 127.0 | −1.1 pp |
| June 2018 | 128.0 | +0.7 pp |
| May 2018 | 127.4 | +0.6 pp |
| April 2018 | 126.8 | −0.8 pp |
| March 2018 | 127.5 | +0.7 pp |
| February 2018 | 126.9 | −0.3 pp |
| January 2018 | 127.2 | +0.6 pp |
| December 2017 | 126.6 | −0.1 pp |
| November 2017 | 126.8 | +1.4 pp |
| October 2017 | 125.4 | −0.7 pp |
| September 2017 | 126.0 | −0.2 pp |
| August 2017 | 126.2 | +0.2 pp |
| July 2017 | 126.0 | +0.2 pp |
| June 2017 | 125.8 | +0.4 pp |
| May 2017 | 125.4 | +0.2 pp |
| April 2017 | 125.2 | +0.4 pp |
| March 2017 | 124.9 | 0.0 pp |
| February 2017 | 124.8 | +0.3 pp |
| January 2017 | 124.6 | +1.0 pp |
| December 2016 | 123.6 | +0.2 pp |
| November 2016 | 123.4 | −1.1 pp |
| October 2016 | 124.5 | 0.0 pp |
| September 2016 | 124.5 | −0.1 pp |
| August 2016 | 124.6 | +0.8 pp |
| July 2016 | 123.8 | −0.3 pp |
| June 2016 | 124.1 | +0.9 pp |
| May 2016 | 123.2 | +0.2 pp |
| April 2016 | 123.0 | +0.1 pp |
| March 2016 | 123.0 | −0.4 pp |
| February 2016 | 123.4 | −0.7 pp |
| January 2016 | 124.1 | +0.8 pp |
| December 2015 | 123.4 | +0.7 pp |
| November 2015 | 122.7 | +0.3 pp |
| October 2015 | 122.4 | +1.7 pp |
| September 2015 | 120.6 | −1.8 pp |
| August 2015 | 122.4 | +1.4 pp |
| July 2015 | 121.0 | −2.7 pp |
| June 2015 | 123.6 | +1.3 pp |
| May 2015 | 122.3 | +0.3 pp |
| April 2015 | 122.0 | −0.3 pp |
| March 2015 | 122.4 | +1.1 pp |
| February 2015 | 121.3 | −0.9 pp |
| January 2015 | 122.1 | +0.5 pp |
| December 2014 | 121.6 | 0.0 pp |
| November 2014 | 121.6 | +0.9 pp |
| October 2014 | 120.7 | +0.5 pp |
| September 2014 | 120.2 | +0.9 pp |
| August 2014 | 119.3 | +2.1 pp |
| July 2014 | 117.2 | −1.5 pp |
| June 2014 | 118.8 | +0.5 pp |
| May 2014 | 118.2 | +2.4 pp |
| April 2014 | 115.8 | −0.6 pp |
| March 2014 | 116.3 | +0.9 pp |
| February 2014 | 115.4 | +0.5 pp |
| January 2014 | 114.9 | +0.8 pp |
| December 2013 | 114.1 | −0.2 pp |
| November 2013 | 114.2 | +0.8 pp |
| October 2013 | 113.5 | +0.5 pp |
| September 2013 | 113.0 | +0.1 pp |
| August 2013 | 112.9 | +0.9 pp |
| July 2013 | 112.0 | −1.3 pp |
| June 2013 | 113.3 | +2.1 pp |
| May 2013 | 111.2 | +1.3 pp |
| April 2013 | 109.8 | +0.9 pp |
| March 2013 | 109.0 | +2.0 pp |
| February 2013 | 107.0 | +0.5 pp |
| January 2013 | 106.5 | +0.5 pp |
| December 2012 | 106.1 | −0.3 pp |
| November 2012 | 106.3 | +1.3 pp |
| October 2012 | 105.1 | −0.5 pp |
| September 2012 | 105.5 | −0.7 pp |
| August 2012 | 106.3 | +1.5 pp |
| July 2012 | 104.8 | −0.7 pp |
| June 2012 | 105.4 | −0.1 pp |
| May 2012 | 105.5 | +1.4 pp |
| April 2012 | 104.2 | +0.9 pp |
| March 2012 | 103.3 | +1.6 pp |
| February 2012 | 101.7 | −0.6 pp |
| January 2012 | 102.3 | +1.3 pp |
| December 2011 | 101.0 | −0.1 pp |
| November 2011 | 101.1 | −0.1 pp |
| October 2011 | 101.1 | +1.6 pp |
| September 2011 | 99.5 | +1.7 pp |
| August 2011 | 97.7 | +0.6 pp |
| July 2011 | 97.1 | +0.2 pp |
| June 2011 | 97.0 | +1.1 pp |
| May 2011 | 95.9 | +1.5 pp |
| April 2011 | 94.3 | +1.6 pp |
| March 2011 | 92.7 | +1.3 pp |
| February 2011 | 91.4 | +0.9 pp |
| January 2011 | 90.5 | +2.0 pp |
| December 2010 | 88.5 | +0.2 pp |
| November 2010 | 88.4 | +1.8 pp |
| October 2010 | 86.5 | −0.2 pp |
| September 2010 | 86.7 | +1.0 pp |
| August 2010 | 85.7 | +1.5 pp |
| July 2010 | 84.2 | −0.1 pp |
| June 2010 | 84.4 | −0.8 pp |
| May 2010 | 85.2 | +1.7 pp |
| April 2010 | 83.5 | +1.4 pp |
| March 2010 | 82.1 | +0.9 pp |
| February 2010 | 81.2 | −0.1 pp |
| January 2010 | 81.3 | +0.6 pp |
| December 2009 | 80.6 | −0.5 pp |
| November 2009 | 81.1 | −0.4 pp |
| October 2009 | 81.5 | +0.2 pp |
| September 2009 | 81.3 | −0.5 pp |
| August 2009 | 81.8 | +0.6 pp |
| July 2009 | 81.2 | −1.7 pp |
| June 2009 | 82.9 | +0.2 pp |
| May 2009 | 82.6 | −0.4 pp |
| April 2009 | 83.0 | +0.8 pp |
| March 2009 | 82.2 | −0.3 pp |
| February 2009 | 82.5 | −1.4 pp |
| January 2009 | 83.9 | −0.2 pp |
| December 2008 | 84.1 | −3.3 pp |
| November 2008 | 87.4 | −2.0 pp |
| October 2008 | 89.5 | +0.2 pp |
| September 2008 | 89.2 | −0.6 pp |
| August 2008 | 89.9 | +3.1 pp |
| July 2008 | 86.8 | −0.6 pp |
| June 2008 | 87.4 | +0.2 pp |
| May 2008 | 87.2 | +2.1 pp |
| April 2008 | 85.1 | +0.3 pp |
| March 2008 | 84.8 | −0.5 pp |
| February 2008 | 85.4 | +1.5 pp |
| January 2008 | 83.9 | +0.6 pp |
| December 2007 | 83.2 | −0.5 pp |
| November 2007 | 83.7 | +1.5 pp |
| October 2007 | 82.2 | +1.3 pp |
| September 2007 | 81.0 | +0.8 pp |
| August 2007 | 80.2 | +1.9 pp |
| July 2007 | 78.3 | +0.5 pp |
| June 2007 | 77.7 | +0.8 pp |
| May 2007 | 76.9 | +0.9 pp |
| April 2007 | 76.0 | +0.7 pp |
| March 2007 | 75.2 | +1.3 pp |
| February 2007 | 74.0 | +0.8 pp |
| January 2007 | 73.2 | −1.1 pp |
| December 2006 | 74.3 | +0.4 pp |
| November 2006 | 73.9 | +0.3 pp |
| October 2006 | 73.6 | −0.3 pp |
| September 2006 | 73.9 | −0.5 pp |
| August 2006 | 74.4 | −0.7 pp |
| July 2006 | 75.1 | +2.2 pp |
| June 2006 | 72.9 | +2.4 pp |
| May 2006 | 70.5 | +0.1 pp |
| April 2006 | 70.4 | +1.8 pp |
| March 2006 | 68.6 | +1.6 pp |
| February 2006 | 67.0 | +0.2 pp |
| January 2006 | 66.8 | +1.1 pp |
| December 2005 | 65.7 | 0.0 pp |
| November 2005 | 65.8 | −0.4 pp |
| October 2005 | 66.1 | +1.4 pp |
| September 2005 | 64.7 | +0.2 pp |
| August 2005 | 64.6 | +0.8 pp |
| July 2005 | 63.8 | −0.2 pp |
| June 2005 | 64.0 | +0.8 pp |
| May 2005 | 63.2 | +2.2 pp |
| April 2005 | 61.0 | +0.4 pp |
| March 2005 | 60.6 | +1.4 pp |
| February 2005 | 59.3 | +0.8 pp |
| January 2005 | 58.5 | +3.1 pp |
| December 2004 | 55.4 | +0.2 pp |
| November 2004 | 55.2 | +1.0 pp |
| October 2004 | 54.2 | −0.3 pp |
| September 2004 | 54.5 | −0.4 pp |
| August 2004 | 54.9 | +0.1 pp |
| July 2004 | 54.8 | +0.1 pp |
| June 2004 | 54.7 | −0.2 pp |
| May 2004 | 54.9 | +2.2 pp |
| April 2004 | 52.7 | +2.4 pp |
| March 2004 | 50.3 | +1.5 pp |
| February 2004 | 48.8 | +0.4 pp |
| January 2004 | 48.5 | +0.2 pp |
| December 2003 | 48.3 | +0.7 pp |
| November 2003 | 47.6 | +0.7 pp |
| October 2003 | 46.8 | +0.3 pp |
| September 2003 | 46.5 | +0.8 pp |
| August 2003 | 45.7 | −0.1 pp |
| July 2003 | 45.8 | −0.2 pp |
| June 2003 | 46.0 | +0.5 pp |
| May 2003 | 45.5 | −0.7 pp |
| April 2003 | 46.2 | +0.5 pp |
| March 2003 | 45.7 | +2.0 pp |
| February 2003 | 43.8 | +0.1 pp |
| January 2003 | 43.7 |
Related indicators
BankingM2 money supply (weekly)
30.01 trillion TRY
13 November 2026 +1.02%
Debit and credit card spending (weekly)
677.0 billion TRY
13 November 2026 −1.12%
Credit card debt (individual)
3.54 trillion TRY
13 November 2026 +2.04%
Total loan volume (banking sector)
29.29 trillion TRY
13 November 2026 +0.87%
Consumer loans (housing, vehicle, personal)
3.59 trillion TRY
13 November 2026 +0.98%
Housing loan volume
859.0 billion TRY
13 November 2026 +0.46%
What does this indicator measure?
The loan-to-deposit ratio is banks' total cash loans divided by total deposits. It is the "Total Cash Loans / Total Deposits (%)" row of the ratios table in the BRSA's monthly bulletin.
According to the BRSA's metadata, the numerator is the sum of loans, gross non-performing loans and financial lease receivables. The denominator is deposits on the balance sheet (participation funds at participation banks). Both figures are taken from the TL and FX total of the balance sheet.
The sector covers deposit banks, participation banks, and development and investment banks, and includes banks' branches abroad. The data are based on provisional financial statements banks submit to the BRSA, are on a non-consolidated basis and refer to the end of the month.
How to read it
- Above 100, the sector's cash loans exceed its deposits; below 100, they are smaller.
- The ratio moves with changes in both loans and deposits.
- Changes are read in percentage points: a move from 90.0% to 91.0% is a 1-point increase.
- According to the BRSA, past months may be updated when the data for a new month are published. This page re-downloads the whole series at every update.
Common misreadings
- Development and investment banks do not collect deposits but do lend; this ratio includes them. In the same table, the BRSA also publishes the ratio excluding development and investment banks.
- This is the aggregate ratio of the sector, not that of individual banks.
The data on this page are for information only and are not investment advice.
Frequently asked questions
What is the loan-to-deposit ratio in Turkey?
According to the BRSA's monthly bulletin, the banking sector's loan-to-deposit ratio was 91.7% as of September 2026. In the previous month (August 2026) it was 91.3%.
How is the loan-to-deposit ratio calculated?
According to the BRSA's metadata, the sum of loans, gross non-performing loans and financial lease receivables is divided by deposits on the balance sheet and multiplied by 100.
What does a ratio above 100 mean?
It means the cash loans extended by the sector exceed the deposits it has collected. The difference is funded by sources other than deposits (for example equity, loans from abroad and securities issued).
Are participation banks included?
Yes. The ratio is calculated from the total of deposit banks, participation banks, and development and investment banks; for participation banks, participation funds are used instead of deposits.
When are the data released?
The BRSA publishes monthly banking data about one month after the end of the month concerned. Next monthly release in the calendar: Monday 30 November 2026, 14:00.